Content ROI Waterfall: Build a Revenue Model in Sheets

I’ve been in the room when content budgets get cut because the numbers “don’t prove it.” At Proposify, we ranked like crazy. The content was strong, but the narrative didn’t point back to the sale, and attribution lurched toward last touch. At LevelJump, I was juggling sales and marketing. No one had hours to stitch GA4 and CRM data into something finance would sign off on. So we kept arguing instead of compounding.
If you want budget to move, you need a simple model that shows how content contributes to pipeline and ARR, not clicks. That means rules you can defend, math finance can trace, and a cadence you can run without an ops person living in sheets. Perfection isn’t the goal. Credible, consistent, repeatable is.
Key Takeaways:
- Build a simple waterfall that assigns fractional credit across touches, then converts that credit to expected pipeline and ARR
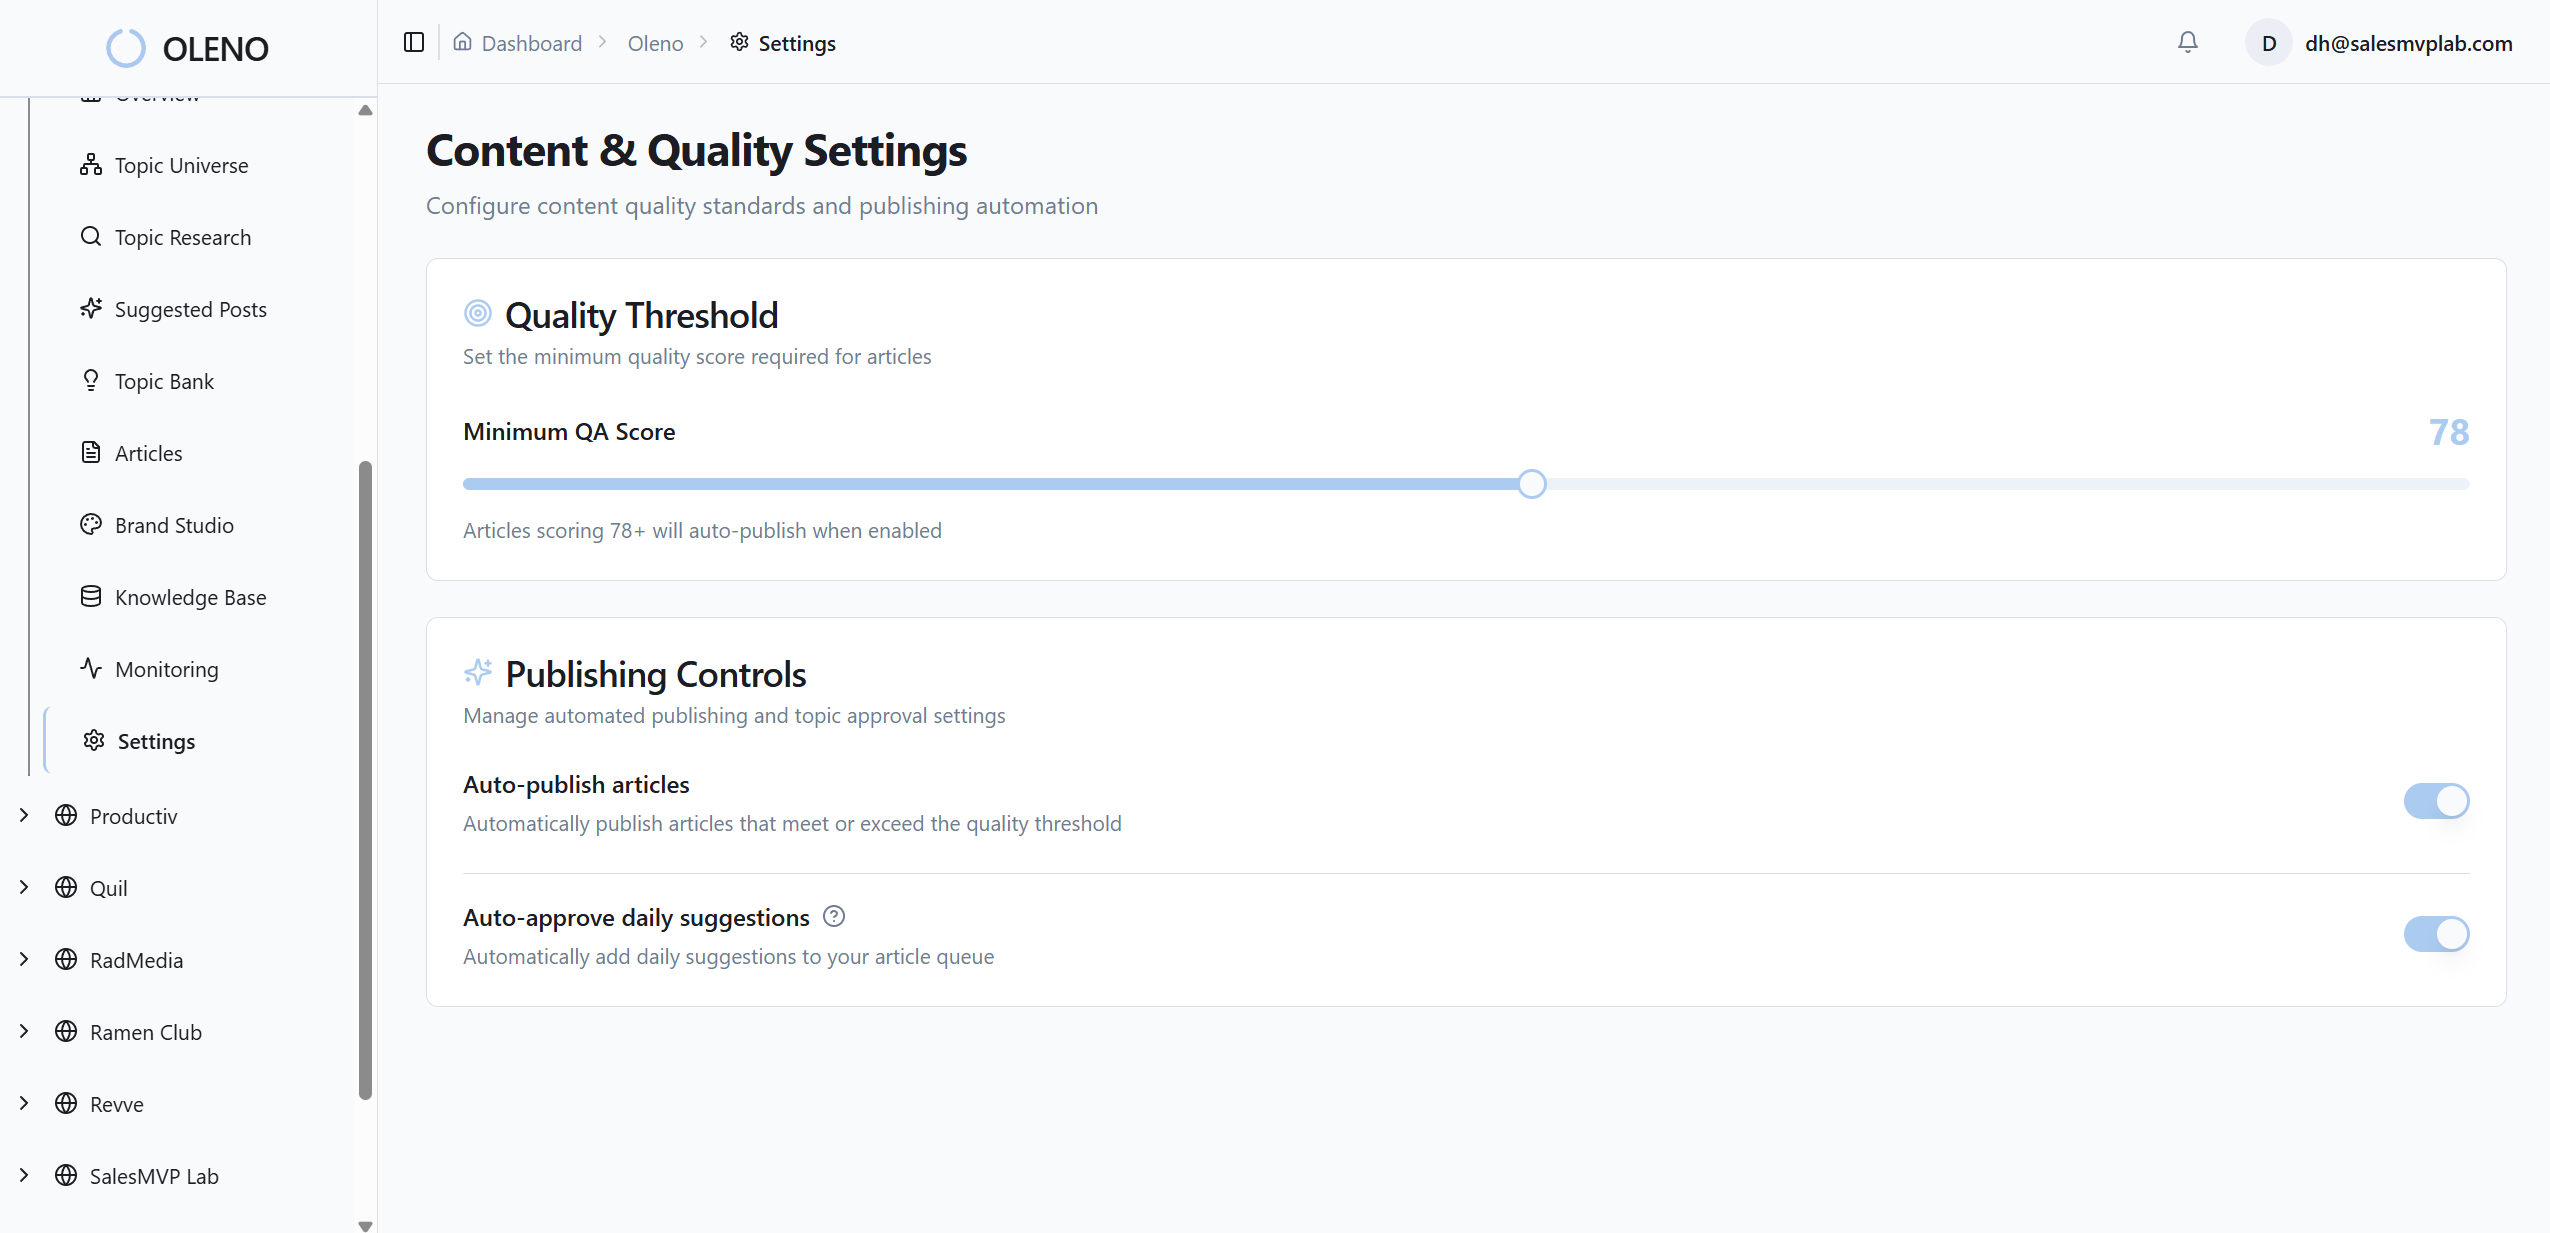
- Set stage definitions, conversion rates, attribution windows, and half-life weights before building the model
- Start with conversion math and ACV, then back into traffic, not the other way around
- Show finance a one-pager with rules first, then numbers: content-assisted MQLs, pipeline, and ARR
- Use time decay and cohorting so old content doesn’t get over-credited and budgets don’t swing wildly
- Keep inputs stable month to month; models earn trust when assumptions don’t drift every cycle
Most Teams Undervalue Content Because They Only See Last Touch
Most teams undervalue content because last-touch reporting concentrates credit on the final click, usually paid or branded search. The fix is fractional credit across all touches, weighted by recency, then pushed through a funnel model. It won’t be perfect, and that’s fine. You need a defendable rule set that finance will accept and you can update every month.

The bias that keeps content underfunded
Last touch rewards closers. It punishes contributors. Early and mid-funnel assets introduce the narrative, frame the problem, and build trust, then paid search or direct snags the final form fill and gets 100 percent of the credit. That skews spend. When we shifted to fractional credit with time decay, we finally saw how “boring” evergreen pieces moved buyers over 60 to 120 days. The result wasn’t magic. It was balance.
You don’t need multi-touch software to fix the bias. You need rules. Define attribution windows by channel, apply a half-life so older touches contribute less, and allocate portions of the expected revenue to each touch. Keep it simple. If your CFO can explain it back, you’re on the right track.
What a waterfall model makes visible
A basic waterfall turns messy journeys into expected revenue per asset by month. You map touches to cohorts, apply weights, push that credit through stage conversion rates, and land on expected pipeline and ARR. Patterns jump out. Which assets consistently assist MQLs. Which categories shape opportunities. Which topics never make it past MQL.
Once the path is visible, budgets start to move. Not overnight. Slowly, and then predictably. If you want a primer on the structure, the walkthrough in the Waterfall Revenue Guide maps cleanly to a spreadsheet approach.
What is a content ROI waterfall and when should you use it?
Think of a content ROI waterfall as a portable, rules-driven model that assigns partial credit to touches and converts that credit into expected pipeline and ARR. Use it when last touch is skewing decisions, when you need a finance-grade view without buying tools, and when you want assumptions that hold up in quarterly reviews. For lean teams, this is the only way to step off the ad hoc deck carousel.
Ready to skip the debate and run a system? Request A Demo.
Define The Funnel And Credit Rules Before You Touch The Spreadsheet
You define the funnel and credit rules first so the math stays explainable. Pick the stages, the conversion rates, the attribution windows, and the half-life per channel. Lock those in. Then build the sheet. Rules first, spreadsheet second. That sequence keeps you out of reconciliation headaches later.

Which stages matter for finance?
Set the stage map upfront. Keep it familiar to finance so conversations don’t derail on definitions. A simple path works: Awareness, MQL, SQL, Opportunity, Closed Won ARR. Add renewal and expansion later if you’ve got the cycles.
For each stage, define a conversion rate and an average time-to-advance. Tie names to CRM picklists exactly. No “SQL” in the model and “SAL” in Salesforce while you argue semantics. If time-to-advance is variable, pick median values and sanity-check against your last two quarters. The goal is stable, defensible assumptions, not one-off hero numbers.
How do you choose attribution windows and half-life values?
Pick windows that match your buying cycle, then apply time decay so old touches don’t hog credit. Practical rule of thumb: 120 days for SEO, 60 days for paid social, 45 days for paid search, 21 days for organic social. Half-life examples: SEO at 60 to 90 days, paid search at 30 to 45 days, social at 14 to 21 days.
In Sheets, your weight can be: =0.5^(days_since_touch/half_life_days). That pushes more credit to recent touches without erasing early influence. If your sales cycle is 180 days, extend the windows proportionally. The point is consistency. Publish the rule set once, then stick to it.
Why start from conversion rates, not clicks
Clicks create noise. Conversion math creates signal. Finance cares about expected value per lead, not your pageviews. Define MQL→SQL, SQL→Opportunity, close rate, and ACV. Expected ARR per new lead equals close_rate multiplied by SQL_rate multiplied by Opp_rate multiplied by ACV. Now you’ve got a baseline value you can allocate based on touches.
Only then do you back into traffic. If you need 20 new opportunities and close 25 percent at 20k ACV, you need 80 SQLs, and so on. The rest is channel planning, not attribution. For stage-by-stage sanity checks, the breakdowns in SaaS Waterfall Metrics line up with this approach.
The Hidden Costs Of Flying Blind On Content ROI
Flying blind on content ROI costs budget, time, and credibility. Last-touch bias underfunds compounding assets. Ad hoc analysis burns hours and increases variance. And without explicit assumptions, finance can’t sign off. That’s three strikes for a small team trying to scale demand with fewer people, not more.
Lost budget from last-touch over-credit
Let’s pretend paid search gets 70 percent of last-touch conversions while content touches happen upstream. If 40 percent of those journeys included content but got zero credit, you could be underfunding content by 20 to 30 percent. That’s the difference between adding 10 more SEO assets next quarter and resetting the program again.
I’ve seen this firsthand. We’d spike a post, call it a win, then the next quarter the budget shifted back to paid because attribution made content look like a bystander. When we brought in decay-weighted multi-touch, some of the least flashy assets became the most valuable lines in the model.
Engineering hours lost to ad hoc analytics wrangling
No model means manual pulls from GA4 and CRM, pivots, VLOOKUPs, and three versions of the same deck. You burn 4 to 8 hours per board report stitching UTMs, deduping leads, and re-creating charts. That’s not strategic time. That’s spreadsheet surgery.
Build the waterfall once, then reuse it monthly. Refresh inputs, regenerate summaries, export the one-pager. Your future self will thank you for fewer “why doesn’t this number match” threads and less frustrating rework. The speed upgrade matters when you’re the marketer who also writes copy and joins sales calls.
What finance needs to sign off
Finance signs off when assumptions are explicit, inputs are versioned, and ranges are shown. Put your conversion rates, ACV, attribution windows, and half-life values on an Inputs tab with sources and dates. Add scenarios: base, conservative, aggressive. Include a short summary page that shows content-assisted MQLs, pipeline, and ARR with footnotes on methodology.
If they can audit it, they can approve it. For framing ROI conversations, the guidance in How To Prove The ROI Of Your Marketing aligns with what FP&A expects to see.
Still wrangling numbers by hand every month? Save the cycles and let a system run the work. Request A Demo.
When Finance Asks Where Pipeline Came From, You Need One Page
You need a one-page executive summary that leads with rules, then shows numbers. It should state the attribution window, decay formula, and conversion table up top, followed by content-assisted MQLs, pipeline, and ARR. Cohort by month. Add footnotes for definitions and the last refresh date. If it reads like finance, it lands.
The meeting where your model falls apart
You know the meeting. Lots of clicks, weak causality. Someone asks, “How did this post contribute to revenue?” Silence. That’s where the waterfall earns its keep. Start with the assumptions, not the outputs. Then show how touch credit rolled up by asset translates into expected pipeline and ARR.
Most objections fade when the rules are clear and the numbers follow the rules. I’ve had tense rooms calm down once we walked through half-life weights and showed the math in the sheet. It’s not about being right. It’s about being consistent.
What makes an exec one pager credible?
Lead with the guardrails. Attribution window, decay formula, stage conversions. Then the tiles: content-assisted MQLs, content-assisted pipeline, content-assisted ARR. Show the ranges. Keep notes tight: half-life values, cohort definitions, data refresh date. Tuck a small sensitivity chart at the bottom.
And keep the chart types familiar. A simple column chart and a small waterfall read fast. If you want a quick visual reference, the layout examples in Financial Waterfall Charts show formats that executives already recognize.
Why small teams need a repeatable method
You can’t out-analyze a bigger org. You can beat them with a model that updates in minutes. Same tabs every month. Refresh inputs, re-run scenarios, export the PDF. Less time defending numbers. More time improving them.
Repeatability becomes your moat when headcount is thin. I had quarters where this was the difference between being in the expansion plan versus being told to “hold steady” for another quarter. The method gave us cover to keep building.
Build The Spreadsheet Waterfall That Maps Content To ARR
You can build a content ROI waterfall in Sheets in a day. Create tabs for inputs, touches, decay weights, stage math, and asset roll-ups. Use simple formulas for time decay and normalization. Push credit through stage conversion rates to calculate expected pipeline and ARR by asset and cohort.
Set up tabs and data inputs
Create these tabs: Inputs, Stages, Touches, Decay, Credit, Asset Summary, Scenarios. Inputs stores ACV, stage conversion rates, attribution windows, half-life by channel, and the last refresh date. Touches holds journey rows exported from GA4 and CRM: user_id, asset_slug, channel, touch_date.
In Decay, calculate days_since_touch and apply weight with =0.5^(days_since_touch/half_life_days). In Credit, filter touches within the attribution window per channel, then normalize by journey so credits sum to 1. Scenarios gives you multipliers for conservative and aggressive cases. Keep it boring. Boring scales.
Model stage conversions and expected value per lead
In Stages, define per-stage conversion rates and derive a cumulative close rate from MQL to Closed Won. Expected ARR per lead equals cumulative_close_rate multiplied by ACV. In Sheets, that’s a simple product referencing Inputs cells. Add optional cohort adjustments if seasonality matters or if funnel health changed after a pricing shift.
Then map each lead’s expected value to their touches using the normalized credits. Now every touch has a fraction of expected value attached to it. This is the bridge between influence and revenue, and it’s explainable.
Apply time decay and allocate touch credit
For each journey, filter touches inside the attribution window. Compute weight with =0.5^(days_since_touch/half_life_days). Group by user_id and journey_id, then normalize: credit equals weight divided by SUMIF of weights for that journey. Assign each touch a fraction of the lead’s expected value.
Keep formulas simple and auditable. SUMIFS for totals, INDEX/MATCH when you need it, and clear named ranges for rates. If you’re coming from revenue ops, the structure won’t surprise you. You’re basically building a scaled-down version of what revenue recognition teams do in Stripe Revenue Recognition Waterfall, but for marketing influence.
Roll up to asset level expected ARR with scenarios
In Asset Summary, aggregate credit by asset and month. Expected ARR equals the sum of credit multiplied by Expected_ARR_per_lead for each touched lead. Layer scenarios by multiplying rates: base equals 1.0, conservative equals 0.8, aggressive equals 1.2, or whatever aligns to your win-rate variance.
Use SUMPRODUCT across credit arrays and scenario multipliers to produce ranges executives can scan quickly. Then rank assets by expected ARR and by pipeline contribution. That ranking becomes your content roadmap. Fund what compounds. Retire what stalled. Interjection. Keep an eye on cohorts to avoid overreacting to one-off spikes.
How Oleno Keeps Your Inputs Consistent So Finance Trusts The Model
A model is only as good as its inputs. Oleno keeps upstream inputs steady by running demand generation as repeatable jobs, with governance rules and quality gates that prevent drift. You still pull GA4 and CRM exports for the sheet. Oleno makes the content engine predictable, which tightens the ranges in your scenarios and reduces swings you can’t explain.
Structured outputs that map cleanly to stages
Oleno runs specific jobs tied to the funnel, so content formats, intents, and cadence stay consistent quarter to quarter. Programmatic SEO produces acquisition content. POV and category education shape how buyers think. Competitive and product marketing content supports evaluation. That structure makes stage mapping cleaner and cohort definitions stable.

Because jobs produce consistent assets, you’re not mapping a new snowflake every week. The Inputs tab in your model changes less. Your MQL mix doesn’t whiplash because the engine didn’t whiplash. That’s how the math stays believable in the room that writes checks.
Quality gates that prevent narrative drift
Oleno enforces a QA gate before anything ships. Voice, narrative structure, approved claims, clarity, and grounding are checked automatically. If a draft misses, it’s revised until it meets the bar. Less drift means assets keep doing the same job in the funnel over time.
When the narrative holds, cohort performance stabilizes. Your decay weights make sense because the content keeps its lane. In practice, that narrows the gap between conservative and aggressive scenarios and reduces the “why did this crash” surprises that erode trust.
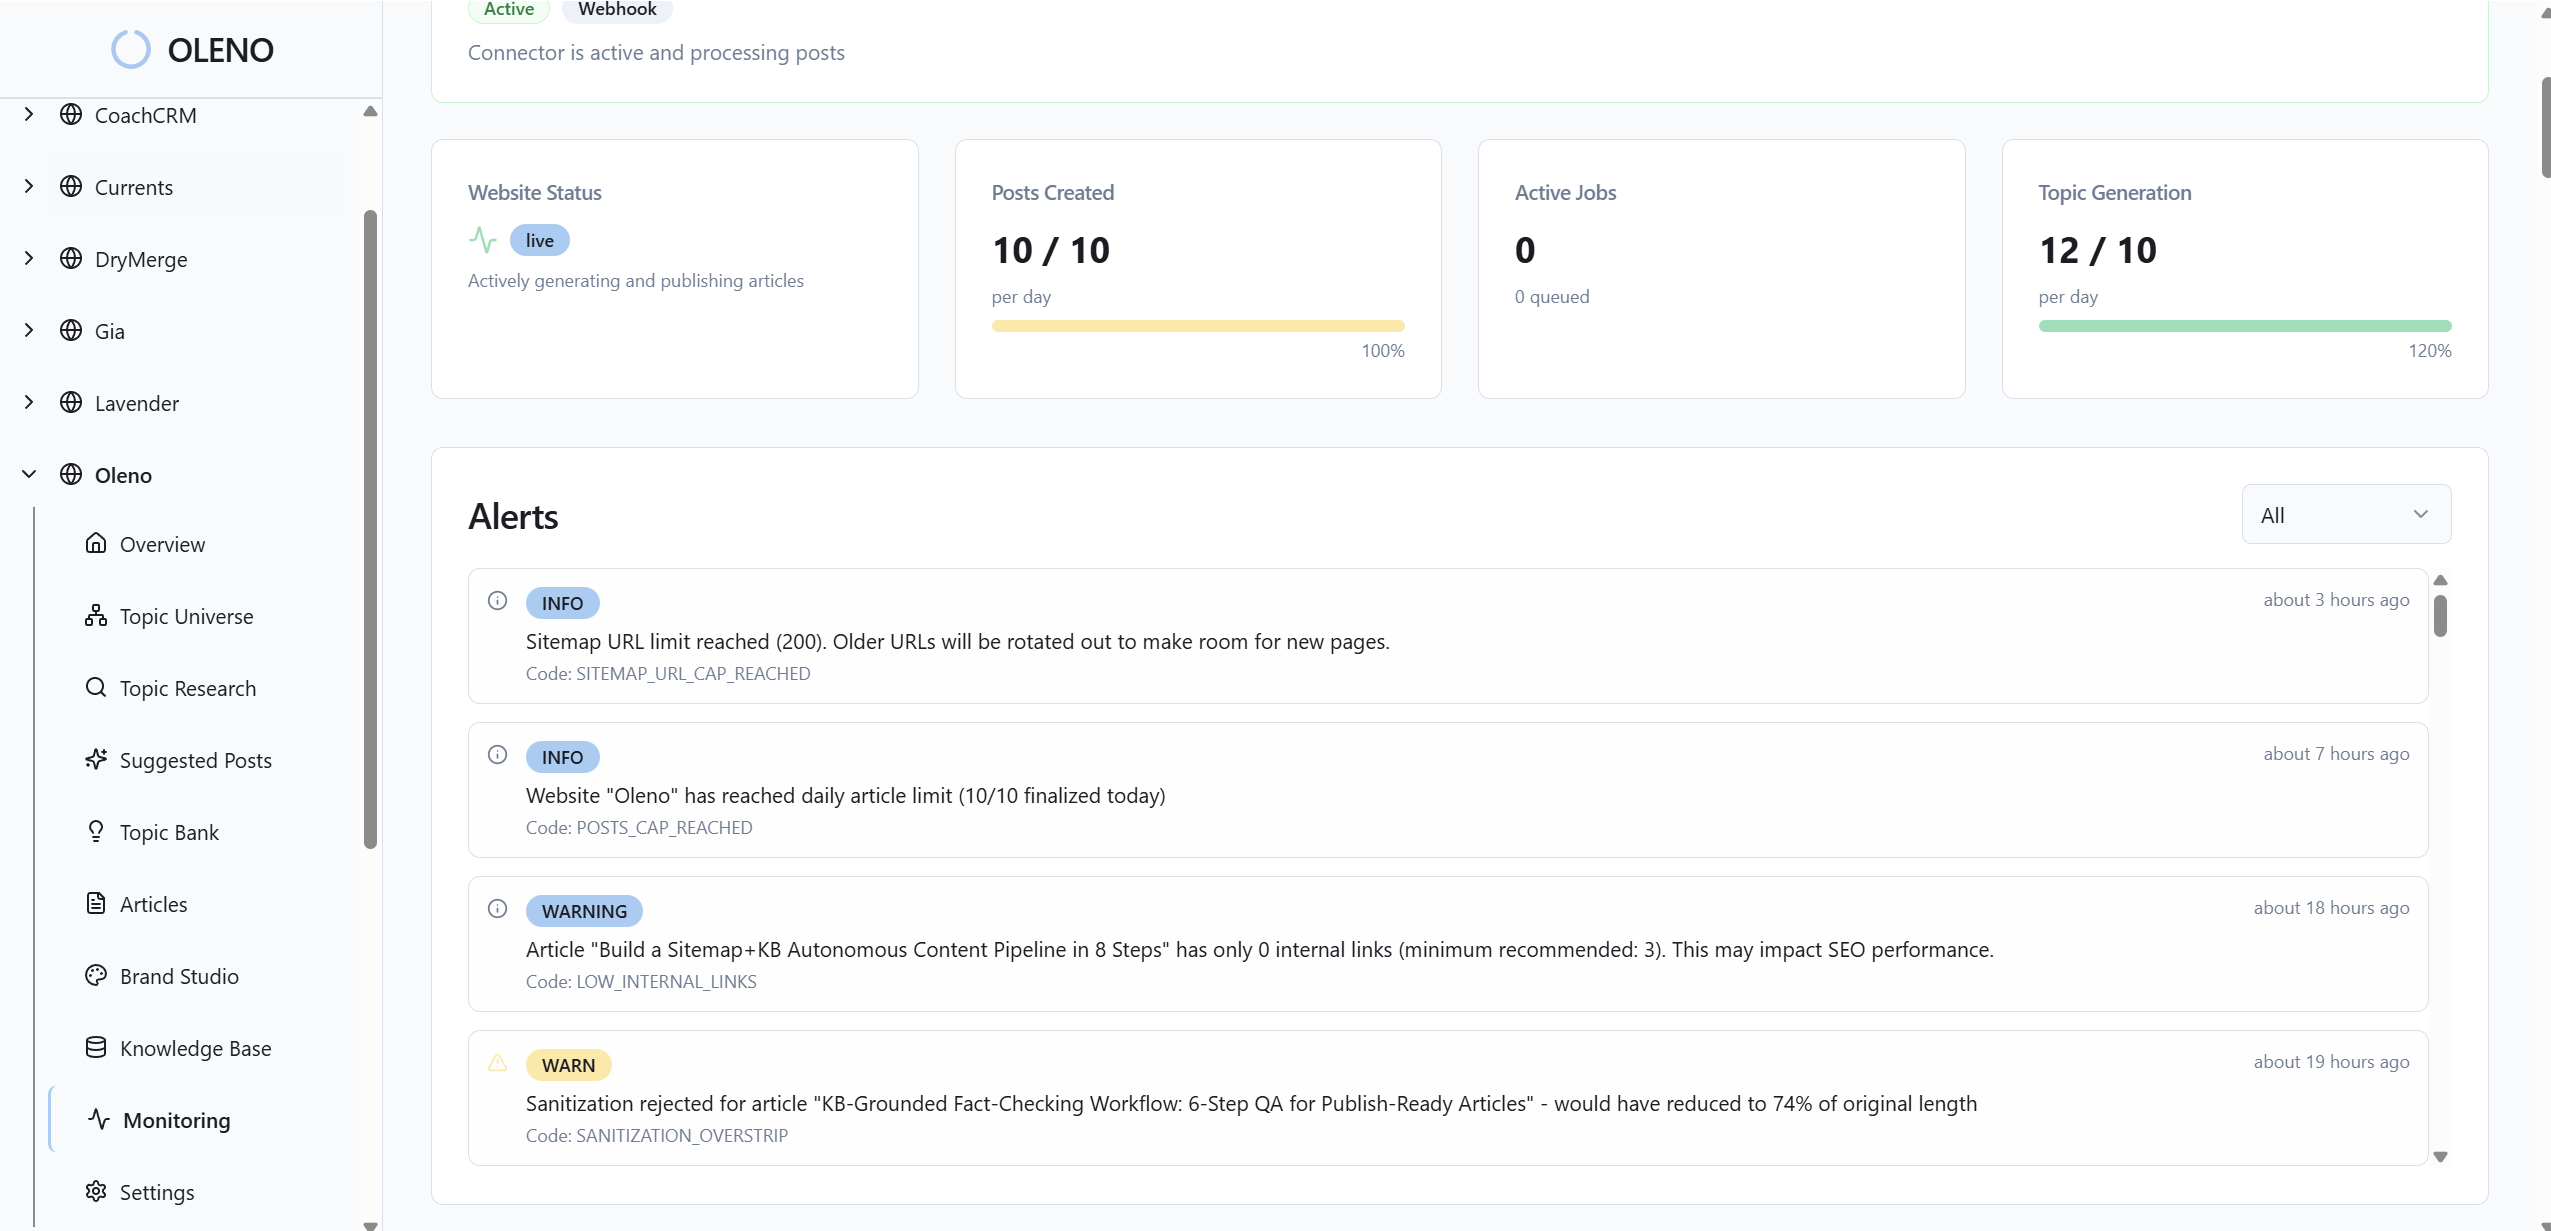
Operational visibility you can plug into the model
Oleno provides visibility into output volume, cadence, and coverage across the flywheel. These aren’t traffic analytics. They’re operational signals that help you forecast inventory growth and plan cohort-level lift assumptions. If you know next quarter’s schedule includes 24 acquisition articles and 8 evaluation pieces, your pipeline forecast isn’t a guess.
Put simply, you define the rules once, Oleno runs the work daily, and your spreadsheet reflects a system that stays on track. If the bottleneck today is fragmented execution and manual coordination, Oleno removes that overhead so your waterfall isn’t built on shifting sand.
Oleno ties this together by:
- Governance setup that defines voice, positioning, product truth, and quality rules once
- Job-based execution that creates acquisition, education, evaluation, and product marketing assets on a cadence
- Deterministic pipelines with QA gates so output meets standards before publishing
- Optional distribution and direct CMS publishing, which reduce coordination cost and keep cadence intact
- Operational visibility to monitor volume and coverage, which feeds your planning without inventing analytics
If your next step is turning consistent inputs into a credible model finance respects, Oleno is the execution layer that makes that possible. Want to see how it would run in your context? Request A Demo.
Conclusion
Content budgets don’t move because a single blog post “performed.” They move when you show a consistent, rules-driven model that turns touches into expected pipeline and ARR, and when your inputs stay steady enough that scenarios don’t swing every month. Build the waterfall once, update it on a cadence, and keep the engine predictable.
I’ve been on both sides, trying to defend content with weak numbers, and tying a simple model to a steady system so finance could say yes. The second path isn’t fancy. It’s just clear. Set the rules, run the work, and let the math do what opinions never will.
About Daniel Hebert
I'm the founder of Oleno, SalesMVP Lab, and yourLumira. Been working in B2B SaaS in both sales and marketing leadership for 13+ years. I specialize in building revenue engines from the ground up. Over the years, I've codified writing frameworks, which are now powering Oleno.
Frequently Asked Questions