Content-to-Revenue Dashboard: GA4 + CRM Attribution for B2B Startups

Most startups brag about traffic. The metric that actually changes your budget is pipeline. A content-to-revenue dashboard gives you that, tying content to contacts, accounts, opportunities, and dollars. When you wire GA4 to your CRM with clean IDs and UTMs, you stop guessing. You can point at specific posts and say, that one opened five deals last month.
I learned it the hard way. Screenshots. Squishy models. Debates with sales about “influence.” Once you align events, UTMs, and CRM fields, the questions calm down. The story gets simple, and your spend shifts to work that moves revenue. It is not fancy. It is clean plumbing and a small set of consistent rules.
Key Takeaways:
- Ship a repeatable GA4 plus CRM schema so every content touch maps to people, accounts, and deals
- Lock UTM rules with allowlists and auto-build links to kill attribution noise at the source
- Use three pragmatic attribution models with SQL-friendly fields you control in CRM
- Validate accuracy with sampling and a small holdout before leaders rely on the dashboard
- In 30 days, aim for a view that attributes at least half of new leads to specific content assets
- Keep the stack boring: GA4 for events, CRM for revenue, a query layer for joins
Most Content-to-Revenue Dashboards Fail Without Deterministic Attribution
Most dashboards fail because they lean on last-click and hope. Deterministic attribution ties a person and account to timestamped content events, then stores the truth in CRM fields you own. When a deal opens, you can prove which assets created demand or assisted it, and you can repeat it with confidence.
Why last-click hides real content ROI
Last-click makes the final touch look like the hero, often branded search or direct traffic. That buries the content that actually created demand weeks earlier. Track first-touch and key assists as events, then map those events to users and companies. Without that map, you underfund top and mid funnel work and chase noise.
Most teams see this after a launch. Branded search spikes, the last step gets all the credit, and your best explainer piece gets ignored. Create an explicit assisted-content event model, tie it to user_id, and store those touches on contact and account. Once you do that, top content stands out in pipeline math, not vanity charts.
What does “deterministic” mean in practice?
Deterministic means identity, not probability. You stitch anonymous client_id to user_id at login or submit, bind UTMs to the session, and push key GA4 events to CRM with IDs. A contact and account now carry first-touch and assist data with timestamps. When the opportunity opens, the proof is in the record, not a model.
Set a low bar that never changes. Collect user_id, persist UTMs, and write content_slug and content_category with every decisive event. Reference GA4’s Attribution overview for model context, then own the fields in CRM. For influence mechanics, review Salesforce’s Campaign Influence basics so your rollups align with sales.
The baseline architecture you actually need
Keep it boring and traceable. GA4 captures sessions and events. CRM owns people, accounts, and money. A query layer stitches IDs. Send key GA4 events with user_id into CRM, store first-touch and key assists on contact and account, then summarize at opportunity. No black boxes. Just joins you can debug and trust.
A quick example helps. A blog view fires content_view with content_slug. A newsletter subscribe persists UTMs and writes to CRM. A demo request links to the same user_id. When the opp opens, your rollup reads those touches and writes a snapshot. That snapshot powers the dashboard and answers budget questions fast.
The Real Job of a Content-to-Revenue Dashboard Is Lead-to-Opportunity Truth
The job is not pretty charts. It is identity, mapping, and lifecycle state tied to revenue. When your dashboard shows content-to-leads, leads-to-opps, and opps-to-revenue with clear IDs, the debates end. Leaders see where money starts, where it accelerates, and where it stalls. That is what earns more budget.
Symptom vs root cause: traffic vs tracking
Traffic growth looks good but proves nothing without identity. The deeper problem is missing stitching, not a lack of pageviews. Capture user_id, store an email hash on form submit, and persist UTMs. Then your reporting moves from sessions to leads created, pipeline opened, and revenue influenced. That is the shift that matters.
I have seen teams celebrate a 50% session bump while bookings flatline. Once we turned on identity and mapped events to CRM, the culprit was obvious. The surge was low-intent visitors. The content that actually started deals was buried. Fix the stitching, and your spend follows the assets that open pipeline.
What data model should your CRM own?
CRM is the money source of truth. Lock a minimal schema: contact, account, opportunity, and a campaign touch or membership object. Add fields for first-touch content, key assist content, and a multi-touch rollup. When CRM owns those fields, finance aligns, and your dashboard stops arguing with booking reports.
Keep naming stable. Version fields only when necessary. If the sales team cannot see the touch data on the record they live in, you will lose trust. Put the proof right on the contact, account, and opportunity. Make the dashboard a window into data they already believe.
Why UTMs are your single point of failure
Bad UTMs poison the well. Standardize five parameters and enforce lowercase, no spaces, and an allowlist for values. Auto-generate links so no one freelances names. If you let people improvise, your attribution gets messy and you pay for it later. Boring UTM rules save budgets. Use Google’s Campaign URL Builder to align on structure.
Add simple routing. Store first-touch UTMs at first contact, then keep latest key assist separate. When names are clean and paths are clear, your queries stay simple. You cut time spent “fixing” reports and put it back into content that wins deals.
The Hidden Cost of Vanity Metrics in Early-Stage B2B
Vanity metrics waste time, money, and leadership patience. Without lead-to-opportunity mapping, teams rebuild reports each month, follow noisy channels, and miss quarters. A clean model reclaims hours and focuses spend. When numbers are defensible, budget conversations change. You stop pleading and start prioritizing.
The time and money you lose without mapping
Without mapping, teams spend weeks screenshotting dashboards that sales will not trust. Budgets drift to channels that look busy, not channels that open pipeline. The real cost is missed targets. A working map turns updates into queries, shows where content creates leads, and reduces reporting fire drills that burn weekends.
I have watched founders cut content after a quarter of “flat” results. Then we map identity, and the story flips. The blog drove half the new leads, but last-click buried it. Once leaders see the opp list tied to URLs, they back the content that starts conversations, not the tactic that steals credit.
Common mistakes teams make in GA4 event design
Teams either track everything or almost nothing. Both fail. Define 8 to 12 decisive events, like content_view, signup_start, demo_request, asset_download, and newsletter_subscribe. Add parameters such as content_slug and content_category. Version carefully. If names drift, your joins break, and the dashboard collapses under tiny inconsistencies.
Make a two-column table in your plan: event name and required parameters. Do not add a new event because someone had a new idea. Extend with parameters first. Only graduate to a new event when behavior is truly different. Discipline here is the guardrail that keeps your model from rotting.
Proof points you can show your CEO next week
Keep it simple. Show leads created by content first touch, opportunities opened with a content assist, and revenue influenced in the last 90 days. Add a ranked list of the top 10 URLs by pipeline. If those numbers tie to contacts and opps the CEO recognizes, trust jumps. So does your budget.
If you need an external sanity check on expectations, review the B2B Institute’s take on long and short demand and why upper funnel matters in revenue windows, like the LinkedIn B2B Institute research. Then tie it back to your own data. Your numbers should speak first.
What It Feels Like When Attribution Is Fuzzy
Fuzzy attribution drains teams. You spend nights patching spreadsheets, defending inconsistencies, and second-guessing where to invest. Clear instrumentation flips that. When events, UTMs, and CRM fields align, reporting becomes a query. Confidence replaces anxiety, and you get back to shipping work that grows pipeline.

The exhausting cycle of ad hoc reporting
You know the drill. Last week’s model disagrees with this week’s pull. Someone updates a filter, and the win rate moves. It is demoralizing. Once identity and event names are stable, you stop “fixing” reports and start comparing cohorts. You also avoid the mistake of changing methods mid-quarter.
Want a durable path out? Export GA4 to BigQuery, then write stable queries against events and parameters you trust. The GA4 BigQuery export docs are straightforward. Keep your query layer versioned in Git. Small teams can run this without ops bloat.
Sales trust collapses when sources do not match
When GA, CRM, and ads disagree, sales tunes out. That distrust leaks into pipeline reviews and headcount asks. Make CRM the money source and GA4 the influence source. Then reconcile once, in the join logic, not every week in slides. When numbers match what reps see, trust rebounds.
I have had reps message me mid-demo asking why “marketing says X” when the opp shows Y. Fix the source, not the slide. Once the opp record tells the same story as your dashboard, people relax. Collaboration returns because the data feels real.
Build Your Content-to-Revenue Dashboard in 2 to 4 Weeks
You can ship a reliable v1 in a month with a 1 to 3 person team. Start with a tracking plan, lock UTM rules, map touches to CRM, then build three simple queries. Keep scope tight. The goal is a defensible dashboard, not the perfect one. You can extend it after it earns trust.
Step 1: Design your events and IDs up front
Start with a one-page plan. List decisive events, required parameters, and owners. Implement user_id on login or form submit, and persist UTMs in first-party cookies. Validate in the GA4 debug view, then run a checklist against a staging flow. Cut scope so you ship a core that will not crack.
Add a small, numbered validation pass before launch:
- Fire each decisive event on a test page and confirm parameters exist
- Create a contact in CRM and verify first-touch UTMs map correctly
- Trigger a demo request and confirm user_id is present on the event and contact
- Open a test opportunity and snapshot touches to the opp
Two hours here saves weeks later. Do not skip it.
Step 2: Enforce UTM hygiene and routing
Create an allowlist for source, medium, and campaign. Use a link builder so names cannot drift. Route all forms through a service that appends stored UTMs, page URL, and referrer to CRM. Now anonymous sessions become named contacts with clean attribution. That is the bridge from traffic to revenue.
Keep rules visible. Put them in your Brand or Marketing playbook. Make sure every partner and teammate uses the same generator. If you do not, a few rogue values will pollute your model. It only takes one messy campaign to break your rollups.
Step 3: Map leads to opportunities and accounts
In CRM, define rules for first-touch content, key assist content, and multi-touch rollups. Use a campaign touch or membership object to store each significant event. When an opportunity opens, summarize touches at contact and account, then write snapshots to the opp. Lock the snapshot so it does not mutate later.
Now sales, finance, and marketing see the same thing. The opp record shows where demand started and what helped. Your dashboard mirrors that truth. No more relabeling data to make a chart look neat. The numbers tie back to real people and deals.
Step 4: Build the dashboard queries and visuals
Query three layers. Content to leads. Leads to opportunities. Opportunities to revenue. Use Looker Studio or your BI tool to visualize a top content by pipeline table, assists by stage, and a 90-day trendline. Add a filter for segment or campaign. Fewer charts, tighter story, faster decisions.
A compact build list helps:
- Content to lead query grouped by content_slug and date
- Assisted opps by content_slug with open date and amount
- Revenue influenced rollup by content_category for 90-day windows
- A ranked table of top 10 URLs by pipeline created in period
Ready to tie content to pipeline in under a month? Request a Demo.
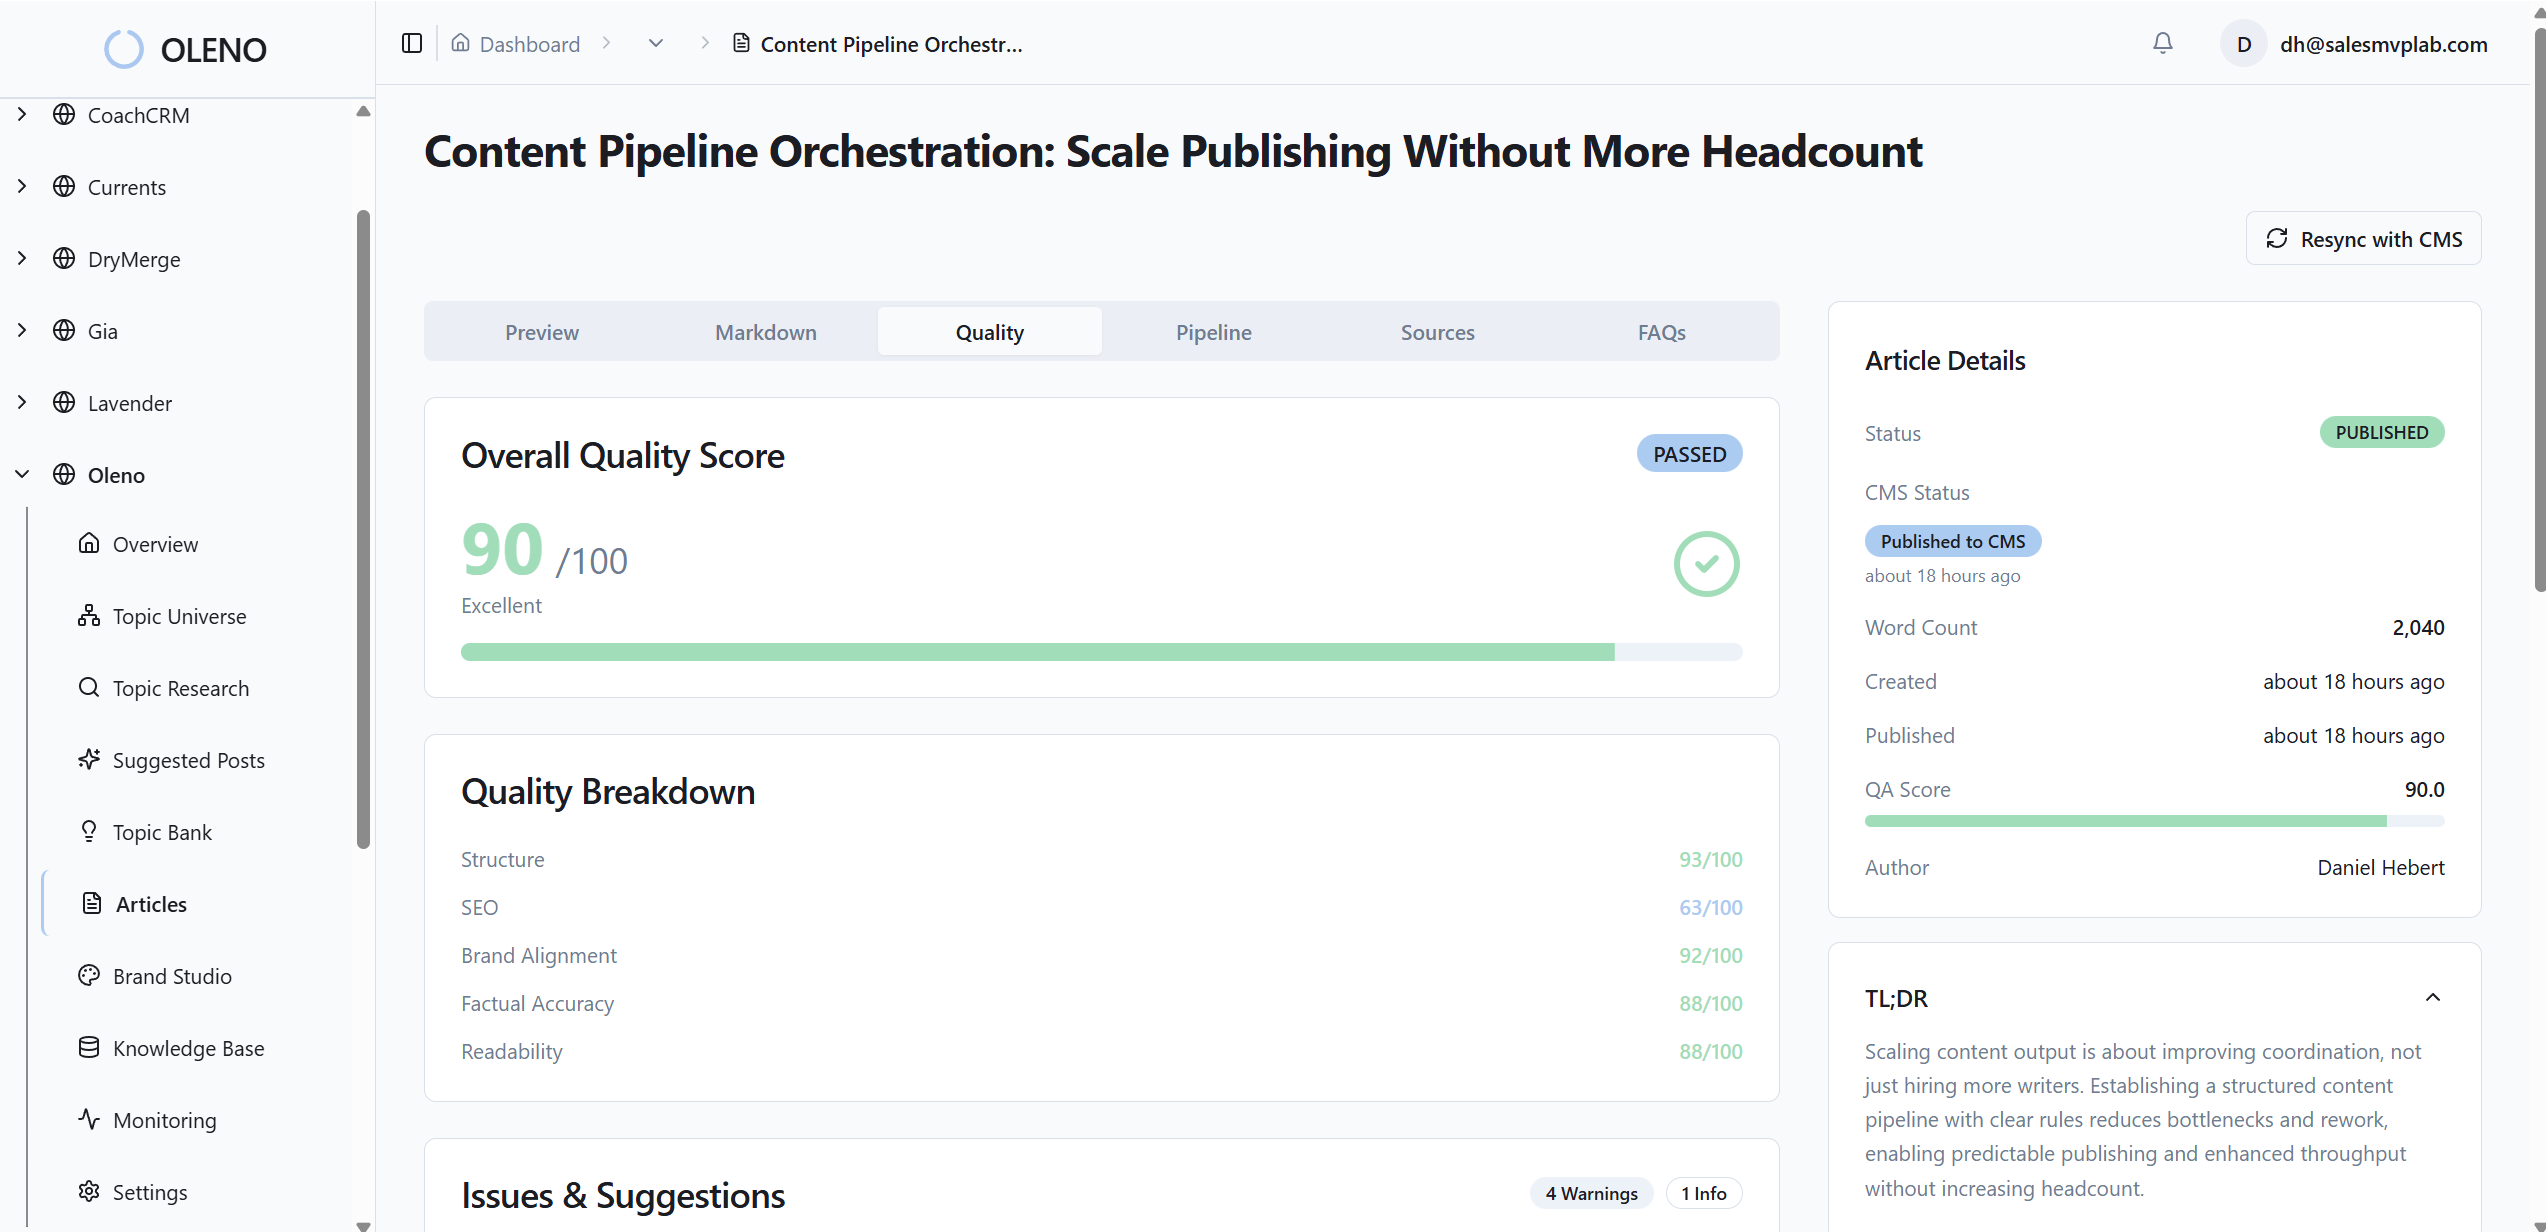
How Oleno Automates Your Content-to-Revenue Dashboard
Oleno makes the New Way easier to run. Governance locks rules so UTMs and events stay clean. The engine captures content touches, stitches them to contacts and accounts, and writes first-touch and assist fields back to your CRM. With prebuilt queries and QA, the review cycle drops from hours to minutes. How Oleno Automates Your Content-to-Revenue Dashboard concept illustration - Oleno
Governance that prevents UTM and event drift
Oleno’s Governance Studios define allowed UTM values, event names, and voice guidelines. Marketing and Product rules sit in one place, so creators do not improvise structure. That consistency prevents the hidden mistakes that corrupt attribution. The payoff is clear joins, fewer fixes, and reports people actually trust.
You can set hard boundaries. Sources on an allowlist. Mediums that never change. Parameters that must exist. Oleno enforces those constraints during creation, so broken links and missing fields never reach your site or CRM. That addresses the earlier cost of rework and “fix it in the report” behavior.
Lead-to-opportunity stitching and influence scoring
Oleno captures content touches with IDs you already use, then stitches them to contacts, accounts, and opportunities. First-touch and key assists write into CRM fields you own. Influence scoring follows your rules, not a black box. Now the opp record shows origin and assists, and your dashboard reflects the same truth.

The result is faster updates and cleaner meetings. No more digging through exports to prove a point. Pipeline by URL is always available. When leaders ask why a post matters, you show the opp list and the amount. The argument ends there.
Stop guessing how much time this will save. Teams cut manual QA and reporting prep by dozens of hours each month once stitching and writebacks go live. Want to see it against your stack? Request a Demo.
Templates for queries, dashboards, and QA
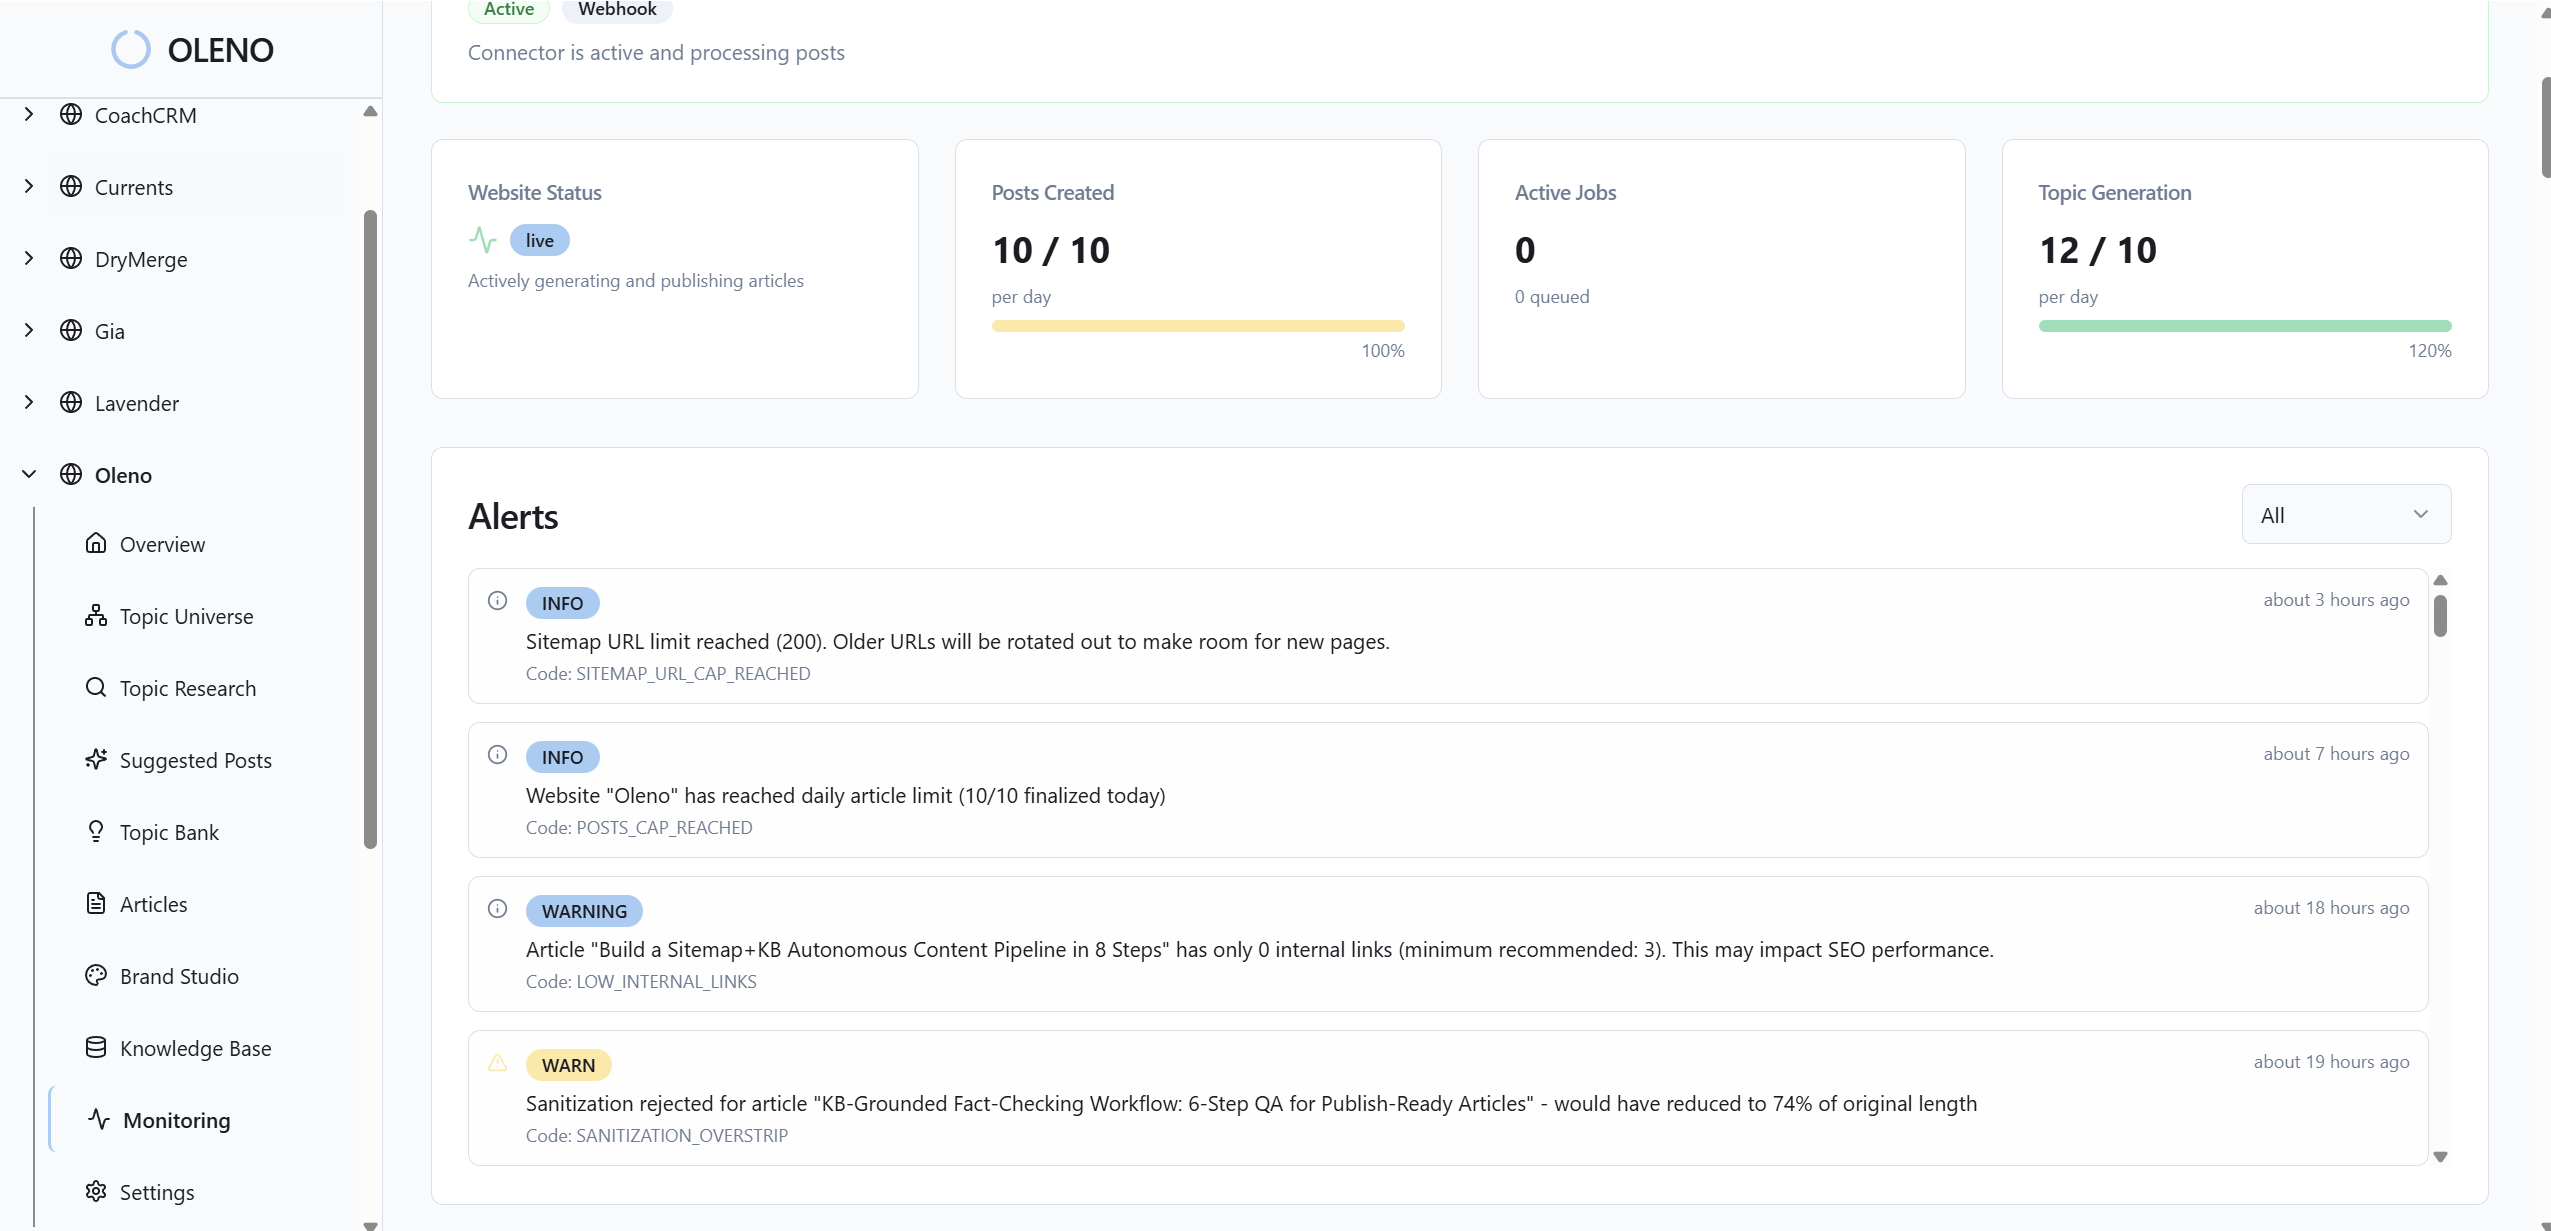
Oleno includes query templates for content-to-leads, assists-to-opps, and revenue rollups, plus Looker Studio layouts that highlight pipeline impact. Automated QA flags missing parameters, off-spec events, and UTM values outside your rules before they pollute your model. What took weeks of coordination becomes a steady flow a tiny team can run.
The most important part, it calls back to the costs you felt earlier. You stop rebuilding spreadsheets. You stop arguing models. You put proof on the record and use the hours you got back to make more content that opens deals. That is the compounding effect you want.
Before you wrap this project, lock your next step. If you want governed UTMs, clean events, and CRM writebacks running in weeks, not months, Book a Demo.
Conclusion
The goal is simple. Build a content-to-revenue system you can defend. Start with a clean event and UTM plan, map touches to CRM, then query content-to-leads, leads-to-opps, and opps-to-revenue. Within 30 days, you should attribute at least half of new leads to specific assets and see MQL-to-Opportunity conversion by URL. That is how you fund what works and cut what does not.
About Daniel Hebert
I'm the founder of Oleno, SalesMVP Lab, and yourLumira. Been working in B2B SaaS in both sales and marketing leadership for 13+ years. I specialize in building revenue engines from the ground up. Over the years, I've codified writing frameworks, which are now powering Oleno.
Frequently Asked Questions