Value Stream Mapping for Demand Gen: Cut Idea-to-Publish Lead Time 50%

Most marketing teams obsess over calendars and output counts. The work still crawls. If you want reliable publish speed, start with value stream mapping for your demand gen workflow. You will see where pieces wait, who blocks progress, and why lead time is unpredictable. The data changes how you manage, not just how you write.
I learned this the hard way. I kept adding tools, prompts, and templates, then wondered why campaigns slipped anyway. When we finally mapped intake to publish, we found the truth. We were not short on ideas. We were drowning in invisible wait time, rework, and too much work in progress. Once we fixed flow, throughput jumped without hiring.
Key Takeaways:
- Measure lead time from intake to live URL and make it your North Star
- Map your flow to reveal hidden WIP, handoffs, and approval queues
- Use simple charts, cumulative flow and cycle time scatter, to spot fast wins
- Cap WIP by stage to cut wait time and stabilize schedules
- Set stage SLAs and stick to them or nothing changes
- Run weekly experiments, one change at a time, and keep what moves the needle
- Expect a 50 percent lead time cut in 6 to 8 weeks and 1.5 to 2x throughput
Value Stream Mapping for Demand Gen: The Hidden Lever Most Teams Ignore
Value stream mapping for demand gen exposes where work actually waits, not where you think it waits. You document every step from intake to publish, then quantify handoffs, queues, and rework. Teams use it to replace vanity output metrics with flow metrics that predict throughput and schedule risk.
Why output counts hide flow problems
Draft counts and full calendars feel like progress, yet pipeline still lags because flow is broken. The review queue grows, approvals slip, and small edits multiply into rework. I have seen teams pat themselves on the back for activity while lead time doubled. When we mapped the flow, the wait time dwarfed the typing time.
You do not need a six month project. Start with a current state map. Pull five recent pieces and trace intake, brief, draft, SME, legal, final edit, publish. Capture the actual dates and the handoffs. Treat every delay as inventory sitting on a shelf. Once you see the shelves, you can empty them.
If you want a quick primer on the method, the basics from the Lean Enterprise Institute are solid. Keep it simple. Flow mapping is not art, it is measurement. The win is naming the queues that steal your week.
What is the single metric that predicts publish speed?
Lead time from idea to publish is the truth. Define it from intake to live URL, then track the median weekly and the 85th percentile for tail risk. When lead time swings wildly, campaigns slip, experiments stall, and forecasting becomes guesswork. Make lead time the headline metric and watch decisions change overnight.
I like to post a small chart on the wall, or in the dashboard you already use. Median for predictability, 85th for the painful outliers. When the tail shrinks, you know your system is getting healthier. When it grows, the queues are back. It is that simple.
If you want a second opinion, the DORA research links stable lead time and higher throughput to better outcomes in software delivery. The same logic applies here. Faster, predictable flow beats sporadic bursts every time. You can scan the DORA research to see how they model it in another domain.
How mapping changes daily behavior
A clear map changes how people work. Writers stop starting three drafts at once. Editors triage reviews by SLA, not by who pings the loudest. SMEs batch approvals in blocks. The team sees the same picture and picks the same battles. That alignment is the hidden payoff, and it compounds.
I have watched teams argue about priorities for months, then align in one hour with a map on the table. Suddenly, the problem is not a person. It is the queue. Once you depersonalize delay, you can fix it without drama. Everyone breathes again.
Stop Optimizing Tasks. Fix the System That Moves Work.
The system that moves work determines throughput, not any single task. If you add tools, prompts, and templates without controlling work in progress and queue time, lead time will not budge. The fix is managing WIP and enforcing stage SLAs so fewer items move faster through the same people.
Why do calendars grow while throughput stalls?
Calendars grow because teams open too many pieces at once. Every new draft adds more context switching, more review debt, and more places for work to wait. You feel busy. You are busy. Yet nothing ships. When we graphed WIP by stage, the pattern was obvious. Too much in flight creates gridlock.
Start by visualizing WIP per stage, research, drafting, SME, legal, final edit. If your editor has ten items queued, nothing is truly next. Cut the in-flight count in half and watch cycle time fall. Quality improves because attention returns. Schedules settle because you removed the churn that causes misses.
If you want a quick reference on WIP discipline, the guide from Kanban University is a good starting point. Do not get lost in jargon. If work waits, limit what you start. If flow stalls, pull less at once. Simple rules win here.
The hidden bottleneck you are not measuring
Approvals, not drafting, set the pace in most teams. A single stuck review can block five pieces and cascade delays across the system. Map where content waits, manager reviews, SME signoff, legal gates, and executive edits. Then measure average queue time by stage. The biggest queue is your real bottleneck.
You will be tempted to staff the wrong place. Resist. Drafting is visible, so it feels like the bottleneck. But the data almost always points to review. Fixing the approval queue first often cuts total lead time faster than adding any tool. Once the major queue shrinks, re-measure and pick the next constraint.
The physics of flow are simple. Work accelerates when you reduce wait time at the narrowest point. That is why chasing speed in non-bottleneck steps rarely moves the overall number. Harvard Business Review has a great piece on flow efficiency if you need to socialize the idea. You can find it in their article on lean physics, and it helps executives see why local wins can be global losses.
Why more tools do not fix a broken flow
Tools speed up slices of work. They do not manage the whole system. If your approvals are unpredictable, a faster editor tool cannot save you. If drafts bounce back and forth due to voice issues, a new prompt library will not stop the ping pong. Solve the work system first, then layer tools where they earn their keep.
I am not anti tool. I am anti distraction. Teams burn months integrating shiny software while the real delay sits in the queue they refuse to measure. Capture the queues, cap the WIP, and put your foot on the real brake. Your average week gets lighter almost immediately.
Put Numbers to Flow: Value Stream Mapping for Lead Time, Cycle Time, and WIP
You improve flow by measuring three things with discipline, lead time, cycle time, and WIP. Lead time is intake to publish. Cycle time is active work time only. WIP is how many items are in flight. Track medians and percentiles by content type to avoid mixing patterns that do not belong together.
Define the three flow metrics that matter
Agree on definitions first. Lead time starts when a topic enters the backlog and ends when the URL is live. Cycle time measures time spent actually working on it. WIP is the count of items in progress at any stage. Use medians to avoid averages that lie, then track the 85th percentile for tail risk, especially when evaluating value stream mapping for.
Separate content types. Blog posts do not behave like customer stories or competitive takeouts. Baseline each type for two weeks. Build a small table with medians and 85th percentiles. When you launch a change, look for shifts in both. If the median improves but the tail grows, you introduced risk. Adjust.
You do not need fancy math. A shared sheet works. What matters is a shared language around the numbers so arguments end faster. Once you speak in lead time, cycle time, and WIP, you stop guessing. The team moves from opinion to evidence.
Instrument your workflow without a new tool
Use timestamps you already have, brief created, draft submitted, review completed, publish date. If fields are missing, add simple labels in your PM tool and CMS. Export weekly to a sheet, build a control chart, and set alert thresholds. Consistency beats complexity. Trend visibility, not precision, is the goal.
I prefer a light cadence. Pull the data on Fridays. Update a single dashboard on Mondays. Point to one hotspot to investigate that week. When you keep the ritual simple, the team keeps doing it. When you chase perfect data, the ritual dies.
If you want help explaining the math, here is a clean explainer of Little’s Law from MIT Sloan Management Review. The formula ties WIP and cycle time to throughput. It is a handy way to stop debates about starting more work as a fix.
Use Little’s Law to set WIP limits that stick
Throughput equals WIP divided by cycle time. If you want more throughput, you do not start more work, you right size WIP. Start with WIP equal to the number of assignees per stage, then tune it down until lead time stabilizes. If wait time grows, pull fewer items.
You will hear complaints the first week. That is normal. The gain shows up in week two or three when drafts stop piling up behind an overworked reviewer. Sticking to WIP rules takes discipline. Once the team sees the time savings, the rules start to enforce themselves.
Write the limits and SLAs down. Make them visible. Then protect them during crunch time. That is when the old habits try to creep back in. Your future self will thank you for being stubborn.
What It Feels Like to Work in a Broken Flow for Value stream mapping for
A broken flow feels chaotic even when people work hard. Unpredictable lead time creates late nights, ping pong edits, and missed windows. People lose trust in the plan. Slack pings replace real process. Your best writers burn out while leaders micromanage the last five percent.

The human cost of unpredictable lead time
I have lived the 11 pm rewrite because an executive saw a draft late. Not fun. When lead time is spiky, schedules are fake. People plan their week, then scramble. Morale drops. Quality slips. The team quietly starts avoiding bold work because the rework cost feels too high.
Document the pain in your map notes. Emotion is data. If a stage is a black hole for feedback, write it down. If SME time is a lottery, say it. When you call out the human cost, you create urgency to fix the system instead of blaming people. That shift matters.
There is also a cognitive tax. Context switching shreds focus and wastes hours. McKinsey has written about the cost of switching in knowledge work and it tracks with what I see. Limit WIP, and energy returns. People get to finish. You can find their take in the article on context switching cost.
How much time are you losing to rework?
Rework is hidden waste that compounds across weeks. Track how many review cycles each piece takes and why, voice, facts, positioning, formatting. Create a simple cause chart for the last ten misses. Then fix the upstream rule or template that would have prevented them.
Patterns jump out fast. Voice issues often point to missing examples. Fact errors often point to scattered product truth. Positioning misses point to unclear messages. When you address those upstream, review cycles fall and confidence rises. Cycle time follows.
If reliability frameworks help your org, borrow from SRE. Define SLIs and SLOs for your stages. For example, 90 percent of SME reviews returned within two business days. Error budgets are just slack for the system. When you spend them early, you change your week to recover.
The Playbook: Value Stream Mapping for Demand Gen in 4 Sprints
You can run value stream mapping for demand gen in four short sprints. Map the current state with real data, set SLAs and WIP caps, run weekly experiments to clear the bottleneck, then lock the wins. Expect the first two weeks to feel awkward. The payoff shows up fast in lead time.
Map your current state in one working session
Get everyone who touches the work into a room for 90 minutes. Draw the path from intake to publish. Use five recent pieces and write the actual dates between steps. Capture where handoffs fail, where drafts bounce, and where approvals go silent. End with a short list of hotspots to investigate next.
The goal is not a perfect map. The goal is a shared picture. If you cannot fill a box because the timestamp is missing, that is a finding. If two people disagree on a step name, that is a finding. Every ambiguity becomes a to do for tightening the system next week.
Once the room agrees on the hotspots, pick one to attack. Keep the list small. A long list kills momentum. Momentum is everything here.
Measure, then cap WIP and standardize SLAs
Publish clear SLAs per stage, research, drafting, SME review, legal, final edit. Then set WIP limits that match real capacity. Add visible work policies, definitions of ready and done, so pieces do not bounce. Expect initial resistance. The first week feels slower, then flow evens out and lead time drops, especially when evaluating value stream mapping for.
Write the policies in plain language. Example, drafts cannot enter SME review without approved sources, voice examples, and the one-line thesis. That one rule might kill half your ping pong. When the team sees fewer back and forth loops, they will keep the rule alive.
When you need a reference to socialize SLAs and policies, Atlassian’s material on SLAs is approachable. Keep your version lighter. The best policy is the one people can remember without reading.
Run weekly experiments to remove bottlenecks
Pick one bottleneck and one change for seven days. Try a tighter brief template, batched SME office hours, or automated fact checks before human review. Measure the impact on queue time for that stage. Keep what moves the number. Discard what does not. Do not stack changes.
The cadence matters. One change, one week, one metric. Your chart tells you if it worked. If not, try another angle on the same bottleneck before you jump to a new one. Depth beats dabbling. Your system stabilizes one constraint at a time.
When you find a keeper, lock it into policy and update the map. Then scan the data for the next longest queue. Repeat. This loop is how you compound gains without breaking things.
Ready to see the new approach in action with your own flow data? Request a walkthrough and we can map a slice of your process together, then pressure test one WIP rule. Request a Demo
How Oleno Operationalizes Value Stream Mapping for Demand Gen Teams
Oleno turns value stream mapping into daily behavior. It codifies voice and claims so drafts start right, instruments the flow so lead time and WIP are visible, and schedules work against real capacity so fewer items wait in review. The result is less rework, faster approvals, and steadier cadence.

Governance studios turn rework into prevention
Oleno’s Brand, Marketing, and Product Studios capture tone, messages, approved claims, and examples. Writers and AI drafts pull from the same rules, so voice mismatches and claim errors drop before review. If your map showed rework as your top cost, this cuts it at the source by turning guessing into guardrails.

You do not have to be precious about it. Set preferred terms, banned phrases, and a few golden examples. Lock the product truth so facts do not drift. When reviewers trust the inputs, they move faster. Review cycles shrink because the obvious fixes disappear.
That is how SLAs stop being wishful. They become defaults baked into how content is produced. Less ping pong. More publish.
Flow instrumentation, QA, and publish cadence
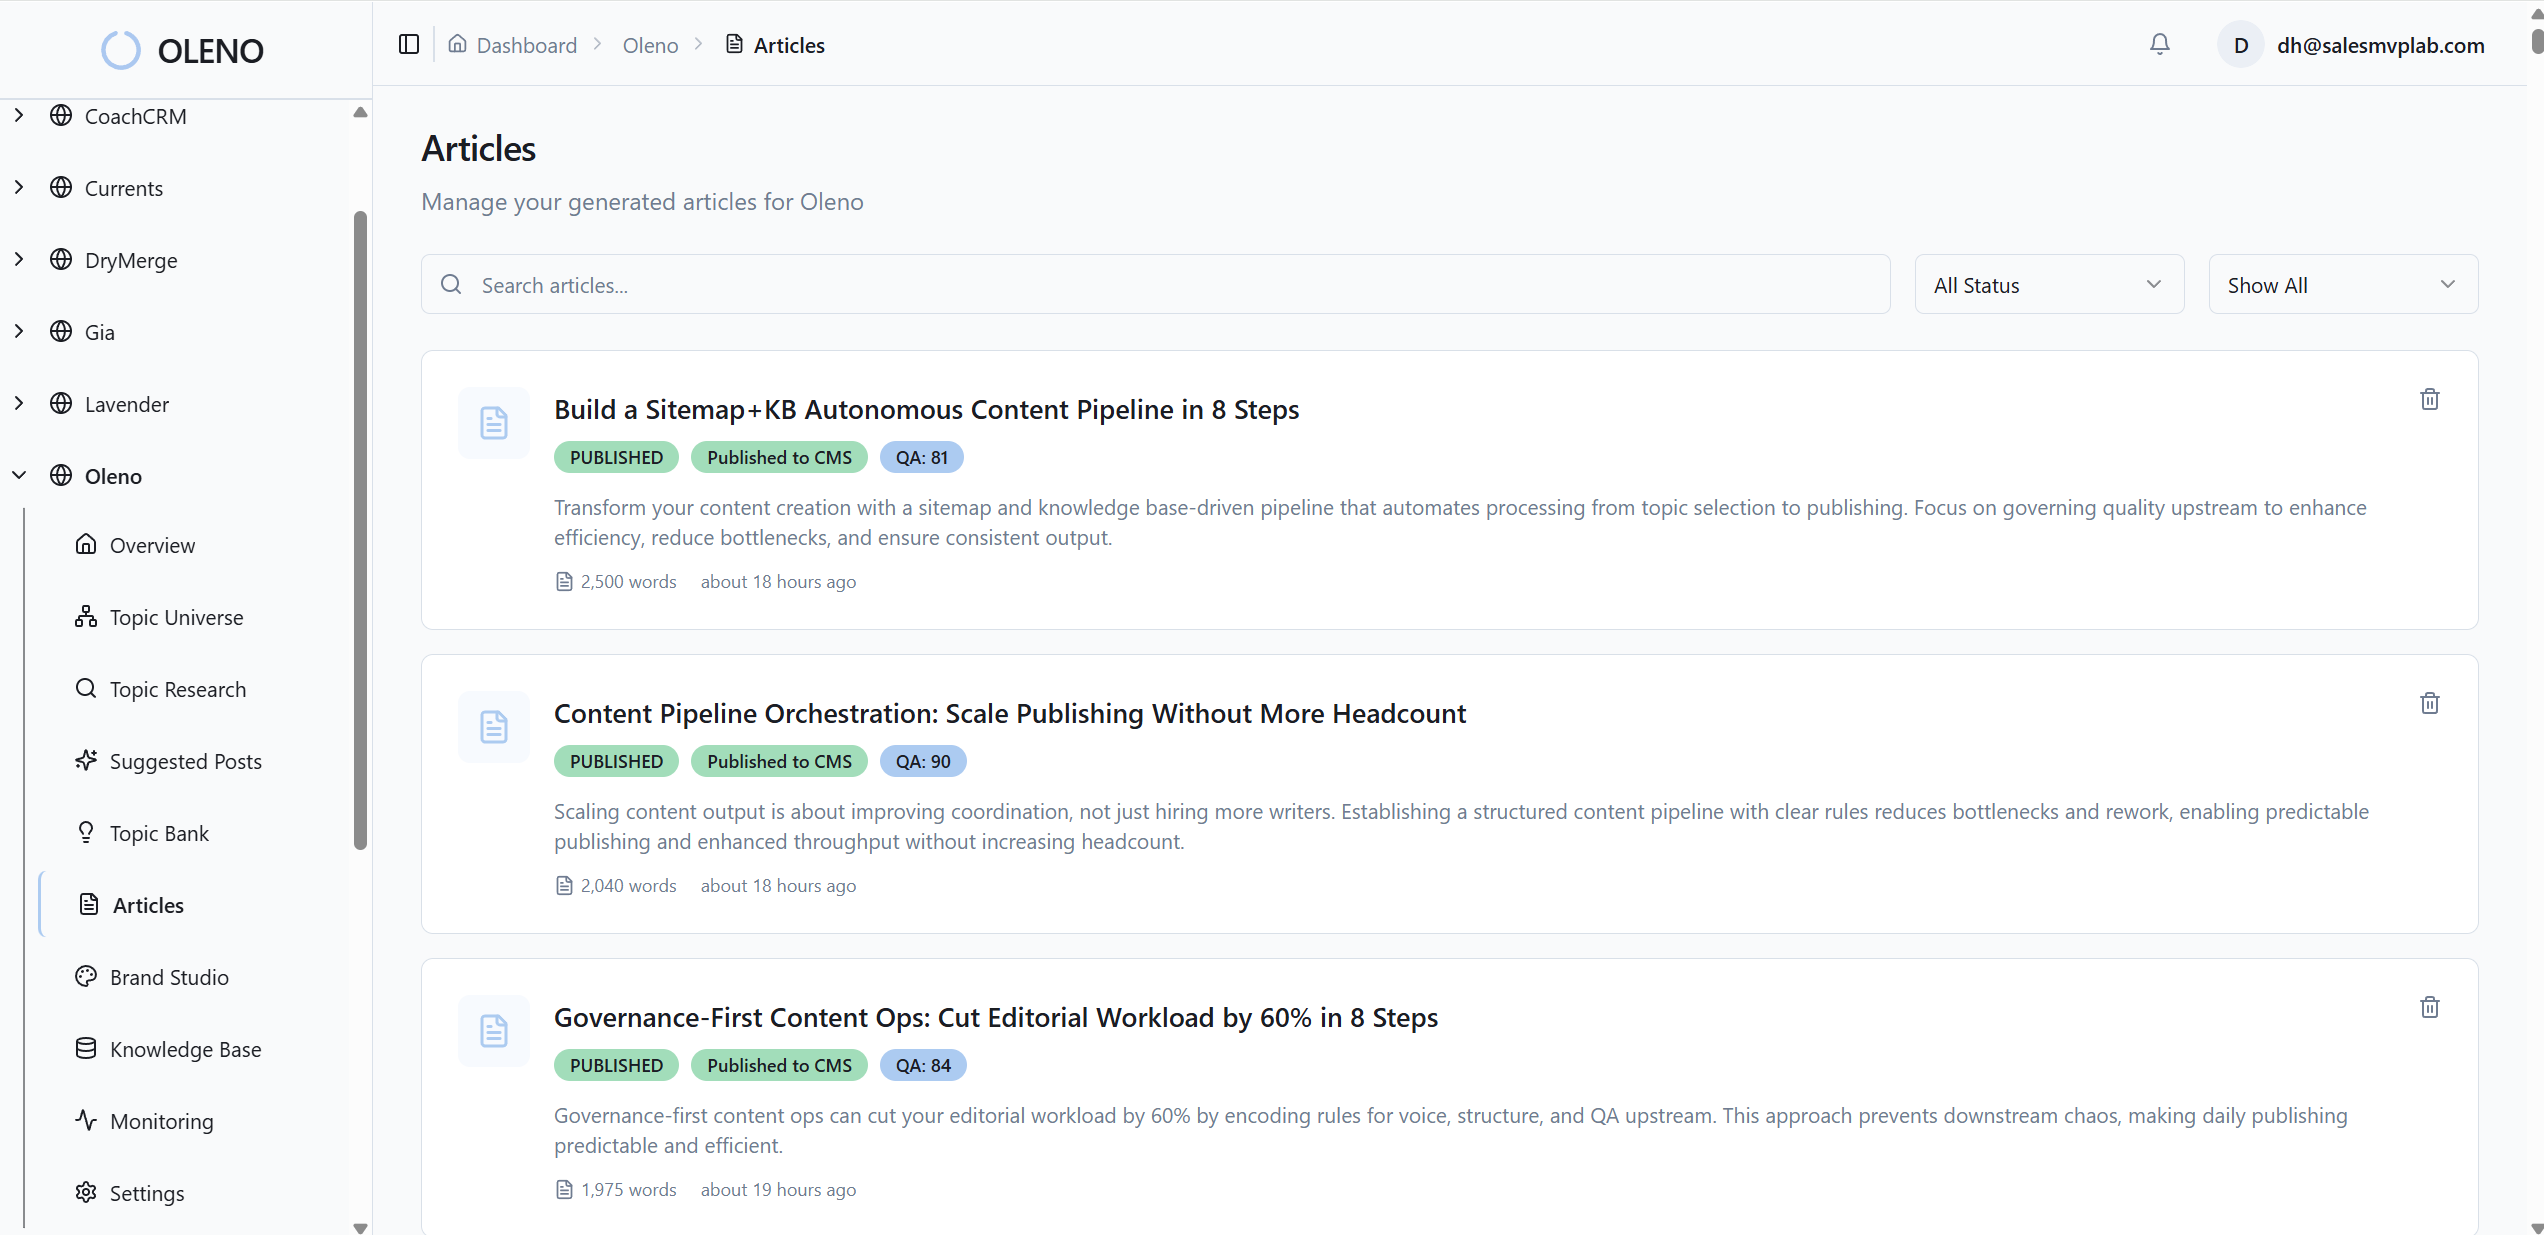
Oleno attaches timestamps from brief to publish, then rolls up lead time, cycle time, and WIP by content type. Automated QA checks voice, facts, structure, and sources before human review. Editors receive cleaner drafts, so queues shorten. Teams that spent 60 percent of time coordinating shift back to creating.
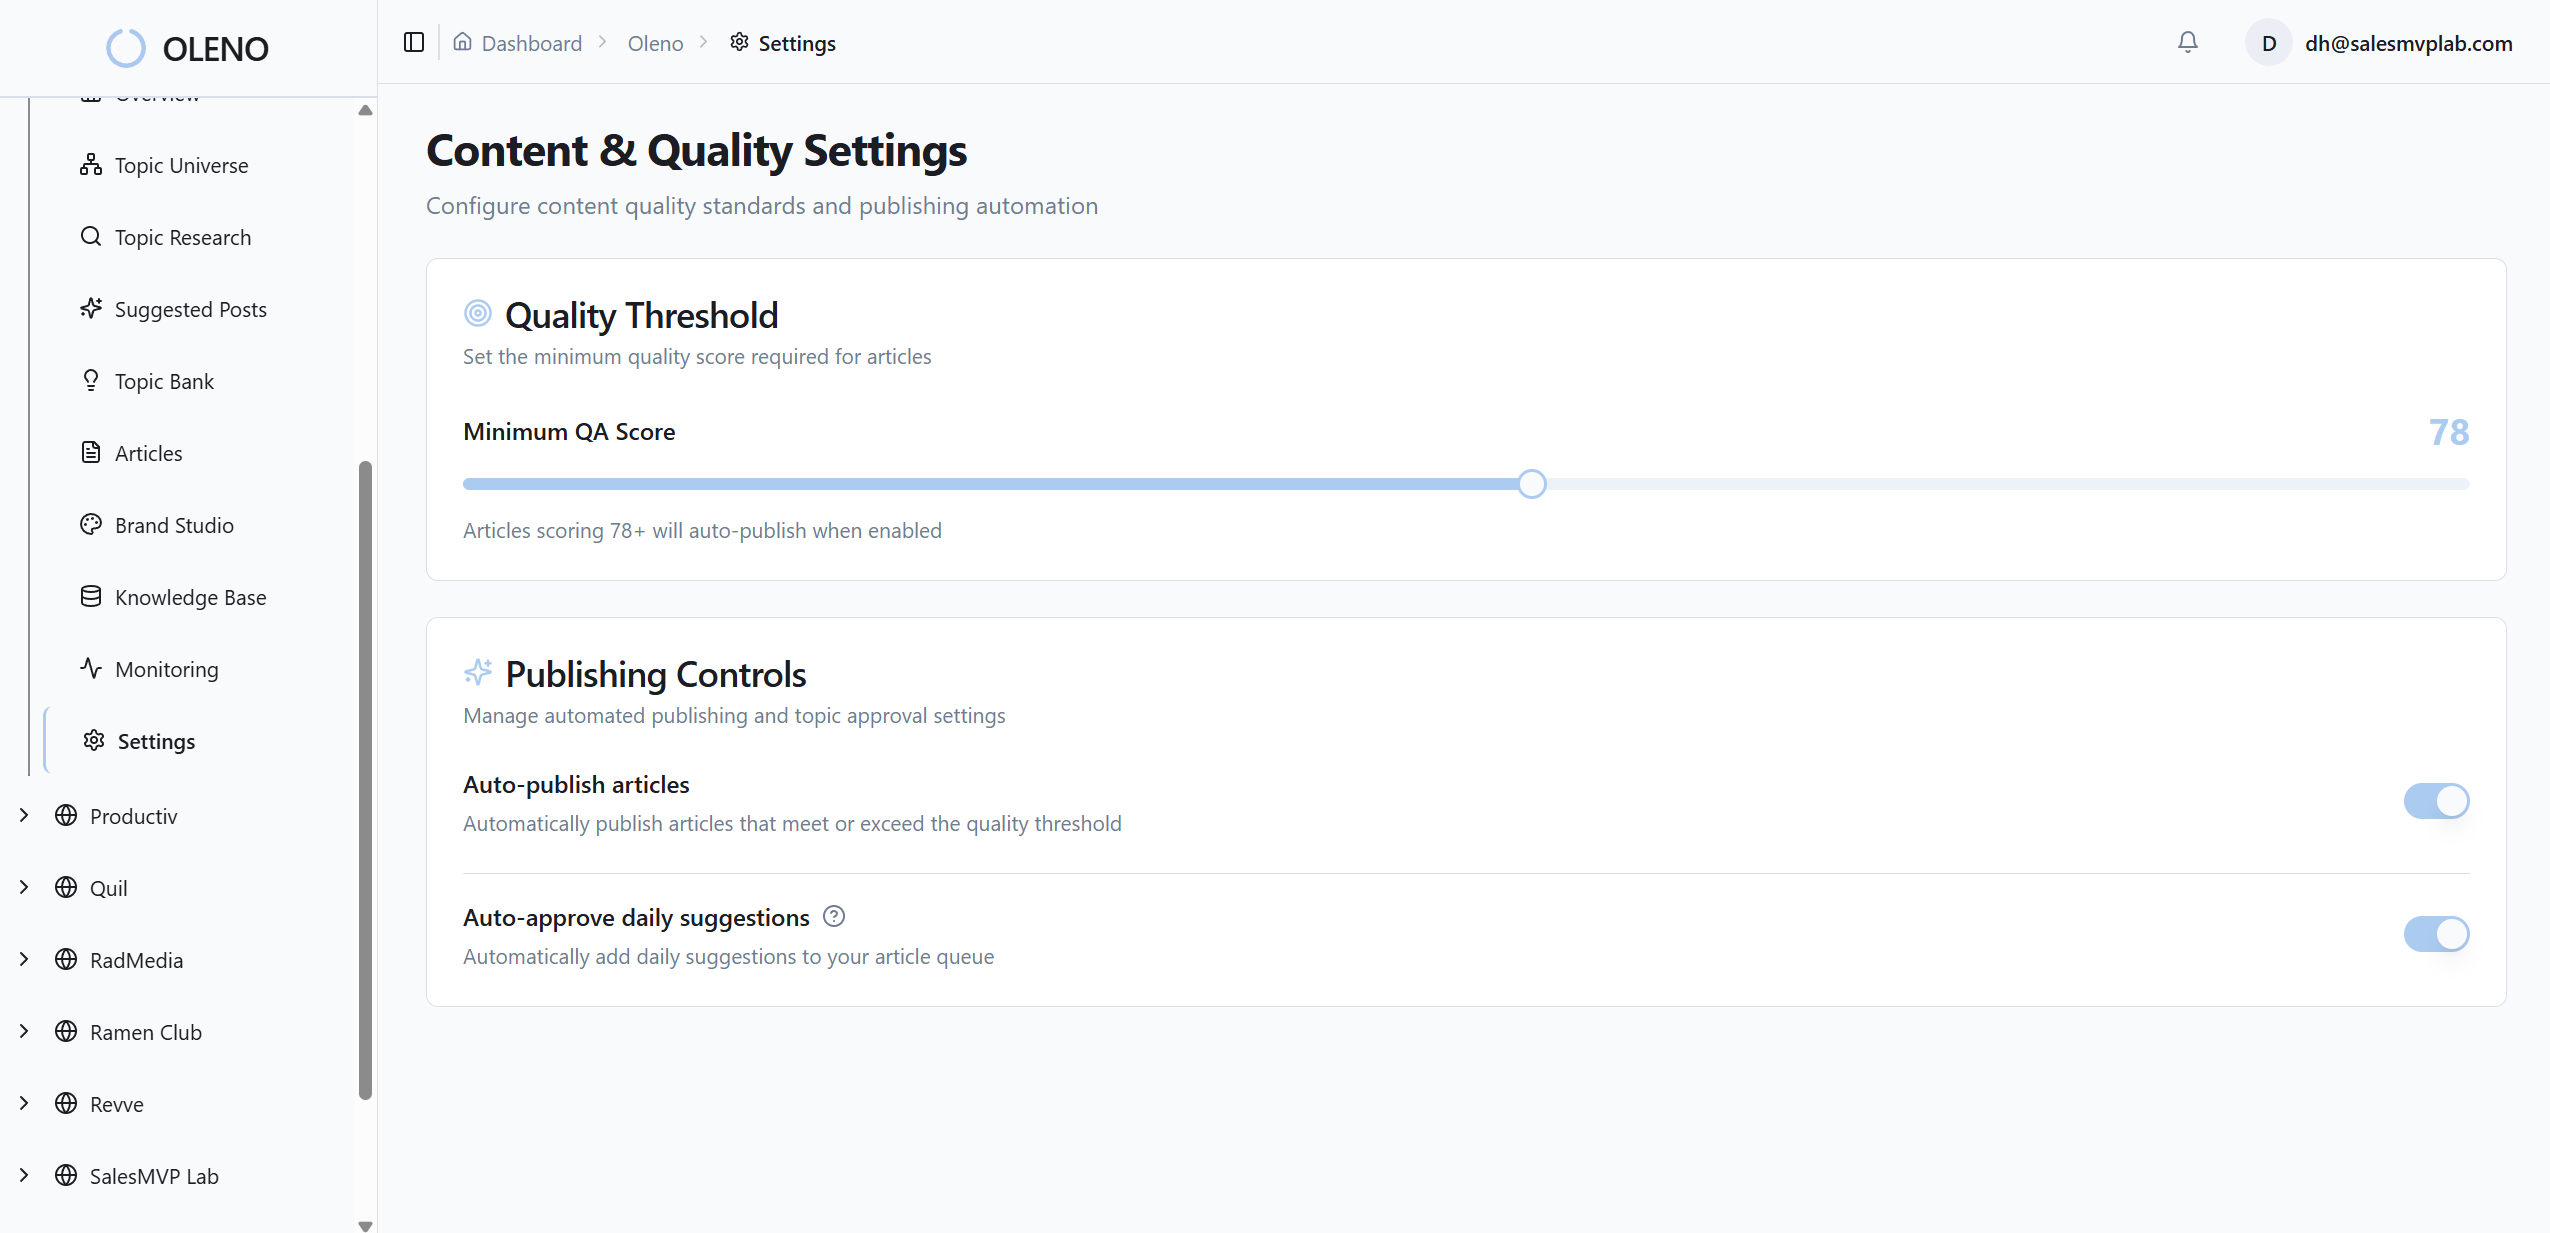
You can slice the numbers by blog, comparison page, or case study. Medians for predictability, percentiles for outliers. When a stage spikes, it is obvious. Fix the spike, then watch the tail shrink. That feedback loop is what keeps throughput steady month after month.
Want to see how automated QA and timestamps cut review time from days to minutes in your flow? Take a look at a live pipeline with your pieces loaded. Request a Demo
Capacity-aware WIP limits and scheduling
Oleno schedules to real capacity. It caps concurrent drafts per role, writer, editor, SME, and batches reviews into blocks. The system will not open ten items for one reviewer. That protects cycle time and keeps lead time stable. Fewer items in flight, faster flow, and less firefighting.
The platform ties back to the math. If WIP creeps up and cycle time grows, throughput drops. Oleno enforces the right side of Little’s Law automatically. You get the gain without policing every move. That is the difference between a good rule written on a wall and a rule that runs in the background.
When you combine governance, QA, and capacity-aware scheduling, the transformation is clear. Review debt falls, lead time becomes predictable, and throughput climbs without adding headcount. That is the goal we set at the start.
Conclusion
If your team runs on output counts and calendar fills, you will miss the real constraint. Map the flow, measure lead time, cap WIP, and run one change per week. The compounding effect is hard to ignore. Most teams can cut idea to publish lead time by about 50 percent in 6 to 8 weeks and raise steady throughput by 1.5 to 2x without hiring.
If you want help getting the first map done and a baseline dashboard live, I am happy to walk through it with you. Bring five recent pieces and we will find the queues that cost you the most. Then we will agree on one experiment to run next week. Book a Demo
About Daniel Hebert
I'm the founder of Oleno, SalesMVP Lab, and yourLumira. Been working in B2B SaaS in both sales and marketing leadership for 13+ years. I specialize in building revenue engines from the ground up. Over the years, I've codified writing frameworks, which are now powering Oleno.
Frequently Asked Questions