Funnel-Aligned Content KPIs: A Playbook to Drive Leads

Traffic that doesn’t turn into pipeline is a mirage. I’ve chased it, celebrated it, and then sat in a forecast meeting wondering why bookings didn’t budge. That’s when it clicks. Content isn’t a scoreboard. It’s a funnel mechanic. If it doesn’t move someone to a next step, it’s just noise.
Here’s what changed my approach. I started assigning jobs to content, not vibes. Top-of-funnel attracts the right people and captures them. Mid-funnel advances them. Bottom-of-funnel earns the meeting and de-risks the decision. Simple on paper. Hard in practice—unless your metrics and narratives line up with how buyers actually buy.
Key Takeaways:
- Align every article to a single funnel stage and one measurable action
- Pick one north-star KPI per stage and two leading indicators to guide iterations
- Avoid last-touch traps; use simple multi-touch for planning and last-touch for tests
- Clean your data first: fix UTMs, event names, and ID stitching before setting targets
- Ship instrumentation, attribution rules, and reporting in one sprint—then tune monthly
- Use systems that produce consistent structure so measurement stays reliable
Why Traffic Without Pipeline Wastes Budget
Traffic without pipeline wastes budget because it optimizes for visibility, not progression. Pageviews mask whether you’re capturing emails, creating meetings, or generating opportunities. If an article doesn’t have a defined next action, it can’t contribute to revenue. A “how-to” guide without the right CTA is exactly that.

The Metrics That Actually Matter
The right metrics tell you if content did its job at that stage, not whether it got attention. Think conversion to email capture on TOFU pieces, MQL-to-SQL progression on MOFU explainers, and demo requests or opportunity creation on BOFU pages. Page-level engagement still matters—just as a diagnostic. Use it to debug, not to declare victory.
I’ve seen teams spend hours optimizing headlines to chase a spike when the CTA was the real blocker. That’s backwards. Start at the outcome, work back to the inputs content can control, and keep it boringly consistent. If you lead a weekly review with pageviews, you’ll incentivize the wrong work. If you lead with stage outcomes, your team will write to the job.
What Is a Funnel-Aligned KPI?
A funnel-aligned KPI is stage-specific, observable in your stack, and realistically influenced by content within a sprint. At the top: qualified non-branded sessions and email capture rate. In the middle: MQL-to-SQL conversion and meeting rate influenced by nurture. At the bottom: demo requests, opportunity creation, and assisted win rate on comparison pages.
You don’t have to over-engineer this. Start with one number per stage. Add two leading indicators to guide iteration (scroll depth and CTA clicks often tell you where friction lives). If a KPI invites gaming—like raw visits—replace it with something narrower. Skyword’s framework for connecting content KPIs to business goals is a useful lens here.
A Story From the Field
I’ve lived the mismatch. At Proposify, we ranked for impressive topics. Traffic looked great. But some articles couldn’t be tied to proposals, signatures, or demos, so sales didn’t feel it. That’s the trap. The content was detached from the product’s job-to-be-done, so pipeline lagged.
Once we tightened the narrative—stage-specific KPIs, clearer CTAs, and content that pointed to “send better proposals, get them signed”—the feedback loop got healthier. Not perfect. But healthier. Content stopped trying to be everything everywhere. It started doing one job well.
Ready to see a structure that already ships measurement-ready? Try this when you’re short on time: Try Oleno For Free.
Align KPIs To Funnel Stages So Content Has a Job
Aligning KPIs to funnel stages gives each piece of content a single job to do. You avoid vague “awareness” goals and measure real progression. The easiest path is a simple decision grid by stage, content type, target metric, and CTA. A comparison page should behave like a BOFU asset.

What Should You Track at TOFU vs MOFU vs BOFU?
Treat TOFU as qualified awareness and capture. Track non-branded qualified sessions, engaged sessions per post, and email capture rate. MOFU is advancement. Track MQL-to-SQL conversion, content-influenced meeting rate, and nurture velocity. BOFU is decision. Track demo requests, opportunity creation, win rate, and time to close.
Here’s the discipline. Map content archetypes to stages once, then hold that line. Don’t let a fluffy “trends” post sneak into BOFU. If you’re not sure what “good” looks like per stage, borrow guardrails from Piwik PRO’s guide to funnel KPIs. Then tune for your sales motion and ACV.
Map Content Archetypes to Funnel Stages With a Simple Grid
Create a one-page grid. Columns: stage, content type, north-star KPI, leading indicators, event to fire, and CTA target. Rows might include TOFU guides and comparisons to capture subscribers, MOFU playbooks and ROI explainers to create MQLs, and BOFU implementation checklists to trigger demo requests.
This grid becomes your enforcement layer. Not a doc that collects dust. Share it with writers, SEs, and SDRs so handoffs feel natural. Interjection. If a content type doesn’t clearly map, it probably needs a clearer point-of-view or a different CTA.
- TOFU: Guides, industry explainers, light comparisons → email capture
- MOFU: Playbooks, ROI explainers, webinars → meeting accepted
- BOFU: Pricing explainers, implementation checklists, competitive swaps → demo request
How Do You Pick a North-Star Metric Per Stage?
Pick one metric per stage that predicts revenue without inviting theatrics. TOFU: qualified subscriber rate or new engaged accounts. MOFU: MQL-to-SQL conversion rate. BOFU: opportunity creation rate from content touches. Keep it simple. Then add two leading indicators per stage, like scroll depth and CTA clicks, to inform weekly iterations.
Sanity-check with your sales leader. If their forecast can’t feel the metric within a quarter, it’s probably not your north star. For ABM-heavy motions, gut-check with account-level views from something like Madison Logic’s full-funnel ABM playbook and calibrate thresholds by segment.
The Hidden Costs of Measuring the Wrong Things
Measuring the wrong things wastes production time, invites rework, and muddies attribution. Pageview spikes trigger headline tweaks, not funnel fixes. Last-touch pats the wrong back. And misattribution hides real lifts that would’ve justified a bigger bet. You feel it in the forecast, not the dashboard.
Hours Lost Chasing Pageviews
Every hour spent explaining a spike is an hour not spent improving conversion. When a report leads with vanity metrics, teams optimize thumbnails and intros. Not CTAs, not offers, not transitions that move someone to a meeting. That creates a loop of frustrating rework.
Flip the report. Stage outcomes first. Diagnostics second. If TOFU capture dropped, then check scroll depth and CTA clicks. If BOFU demo requests dipped, then check load time on the form or friction on the pricing page. You’ll still look at pageviews; they just won’t lead the meeting.
When Does Last-Touch Mislead You?
Last-touch is fine for BOFU landing tests and short cycles. It breaks in multi-stakeholder deals with long runways, where early content builds the shortlist and late touches simply collect credit. Use last-touch for experiments and page-level changes. Use weighted multi-touch for quarterly planning decisions.
As a simple rule, when leads have three or more content touches, expect last-touch to under-credit top-of-funnel assets that opened the door. Pair it with a 40-20-40 model for planning. And align with sales on where first-touch deserves a seat. Cvent’s playbook for sales and marketing alignment is a helpful conversation starter.
Let’s Pretend You Fix Nothing, What Does It Cost?
Let’s pretend you ship 12 posts per month, six hours each, $120 per hour all-in. That’s $8,640 monthly. At sub-1 percent site conversion and 20 demos per month, every point of misattribution can hide two to four demos. At a $10k ACV and 25 percent win rate, a single ignored lift could be $5k–$10k per quarter.
The real cost isn’t the spend. It’s the stalled conviction. When the numbers don’t tie, teams publish timidly. Pipeline softens. Forecasts wobble. And leaders start questioning the channel when the problem was the measurement plan all along.
If this sounds familiar, you don’t need more dashboards. You need cleaner inputs and consistent structure. When you’re ready to reduce the noise, not add to it: Try Using an Autonomous Content Engine for Always-On Publishing.
Baseline and Data Hygiene Before You Set Targets
Baseline first, then targets. Clean your UTMs, fix event names, and stitch IDs across analytics and CRM so conversions have a clear lineage. You can set aggressive goals later, but if the plumbing leaks, you’ll argue numbers every Monday. That’s not a strategy.
Capture and Clean Historical Data
Export the last 6–12 months of content performance and normalize the mess. UTMs to lowercase. Null sources fixed. Campaign names de-duplicated. Standardize content types with URL patterns or CMS tags. Remove internal traffic and bot spikes. Reconcile lead and opportunity IDs across analytics and CRM.
Don’t skip naming conventions. You won’t remember whether “prod-mofu” is different from “product-mofu” in two months. Write the rules down, store them where people can find them, and enforce with guardrails in your tag manager. Your future self will thank you.
How Do You Validate Events and Conversions?
Run an event audit. Confirm event names are consistent: content_view, scroll_75, cta_click, form_start, form_submit, demo_request. Validate triggers fire once and carry the right parameters: page_type, content_type, article_id. Compare analytics conversions to CRM counts for a week. Reconcile gaps until the numbers tie.
When double counting shows up—and it will—fix it at the tag manager level before you publish benchmarks to leadership. No one wants to re-baseline a dashboard two weeks later. You’ll lose trust fast if definitions drift in slide decks.
Create a Source of Truth for Funnel KPIs
Stand up a daily job that writes stage metrics to a warehouse table keyed by date, article_id, and account_id when possible. Maintain a dimension table for content types and stages. Define business rules in SQL, not in a meeting. If a definition changes, version it.
You’re not building a cathedral. You’re building guardrails. Once the pipe runs, reporting gets boring—in a good way. That’s when you can shift energy from defending numbers to improving them.
Ship a Measurement-Ready Playbook in One Sprint
You can instrument, attribute, and report in one sprint if you keep it simple. Standardize UTMs, confirm events, choose two attribution views, and set stage targets with a weekly and monthly cadence. Then iterate. Complexity kills adoption. Start small, prove value, and expand.
Instrumentation Checklist: UTM Taxonomy and Events
Start with UTMs: utm_source, utm_medium, utm_campaign, utm_content. Use lowercase and hyphens. Example conventions: source=organic, medium=blog, campaign=funnel-stage-like-mofu, content=article-slug. GA4 events to implement via GTM: content_view, scroll_75, cta_click, form_start, form_submit, demo_request. Pass page_type, content_type, product_area.
Validate in preview mode, then ship. Document everything in a one-page runbook people will actually open. And yes, put the link in your sprint board. A tidy plan that no one can find is the same as no plan.
- UTM rules: lowercase, hyphens, controlled vocab
- GA4 events: single-fire, parameters enforced
- IDs: article_id present end-to-end
Attribution Rules You Can Actually Use
Use last-touch for BOFU tests and landing variants. Use 40-20-40 for planning—first and last split 80 percent, everything between gets 20 percent. For ABM motions, use account-level touches in a 30-day window. Avoid complex models you can’t maintain. Pick two, run both, and use them for different decisions so no one overfits a single view.
Keep a change log for model tweaks. Tiny shifts have a way of rewriting leaderboards and upsetting roadmaps. Give teams predictability. If you need a quick refresher on full-funnel thinking, Keends’ full funnel optimization overview is concise and practical.
KPI Targets and Reporting Cadence
Set realistic and stretch targets per stage. Examples: TOFU email capture rate 1.5 percent realistic, 2.5 percent stretch. MOFU MQL-to-SQL 25 percent realistic, 35 percent stretch. BOFU demo request rate on BOFU pages 2–5 percent. Report weekly on leading indicators, monthly on stage outcomes. Review attribution monthly, re-baseline quarterly.
Incentives follow stage outcomes, not vanity inputs. If your comp plan rewards pageviews, you’ll get pageviews. If it rewards meetings and opportunities, your content will start behaving like a salesperson that knows its territory.
Dashboard Wireframe and Sample SQL
Wireframe three rows. Row 1: stage summary tiles with north-star metrics. Row 2: content type by stage with capture or conversion rate. Row 3: attribution view with first, multi-touch, and last. Keep charts simple so decisions are obvious. Every tile should answer “what changed and what do we do next?”
Example SQL: SELECT date, utm_campaign, content_type, COUNT(DISTINCT user_pseudo_id) AS readers, SUM(demo_request) AS demos FROM analytics WHERE page_type = 'article' GROUP BY 1,2,3;
How Oleno Powers Measurement-Ready Content Operations
Oleno helps by shipping consistent, on-brand articles that are structurally predictable, which makes your tracking clean. It doesn’t do analytics or performance dashboards. It ensures every article follows rules that your measurement plan can rely on. You get fewer noisy inputs and less manual cleanup.
Snippet-Ready Structure That Makes Tracking Cleaner
Every Oleno article opens each H2 with a direct, snippet-ready answer. The structure is intentionally consistent—three-sentence openers, predictable section order, and clean hierarchy. That means your events can be placed once and reused. Tagging scroll, CTA clicks, or form starts becomes straightforward.
The QA gate enforces structure and removes AI-sounding fluff before publish, which reduces noisy scroll events that come from meandering intros. You still run your own analytics, of course. The point is this: when content ships in a consistent shape, your tracking plan stops fighting the CMS.
Deterministic Internal Links and Schema That Reduce Attribution Noise
Internal links are injected from a verified sitemap, and anchor text matches page titles exactly. No ad-hoc links, no fabricated URLs. Schema is generated as JSON-LD for Article, FAQ, and BreadcrumbList. This isn’t fancy. It’s clean. Clean reduces attribution noise when sessions pass between articles and product pages.

Search engines and assistants also read your structure more reliably, which gently improves the odds your comparison and pricing pages surface at the right time. Consistency compounds. Sloppy link text and missing metadata don’t.
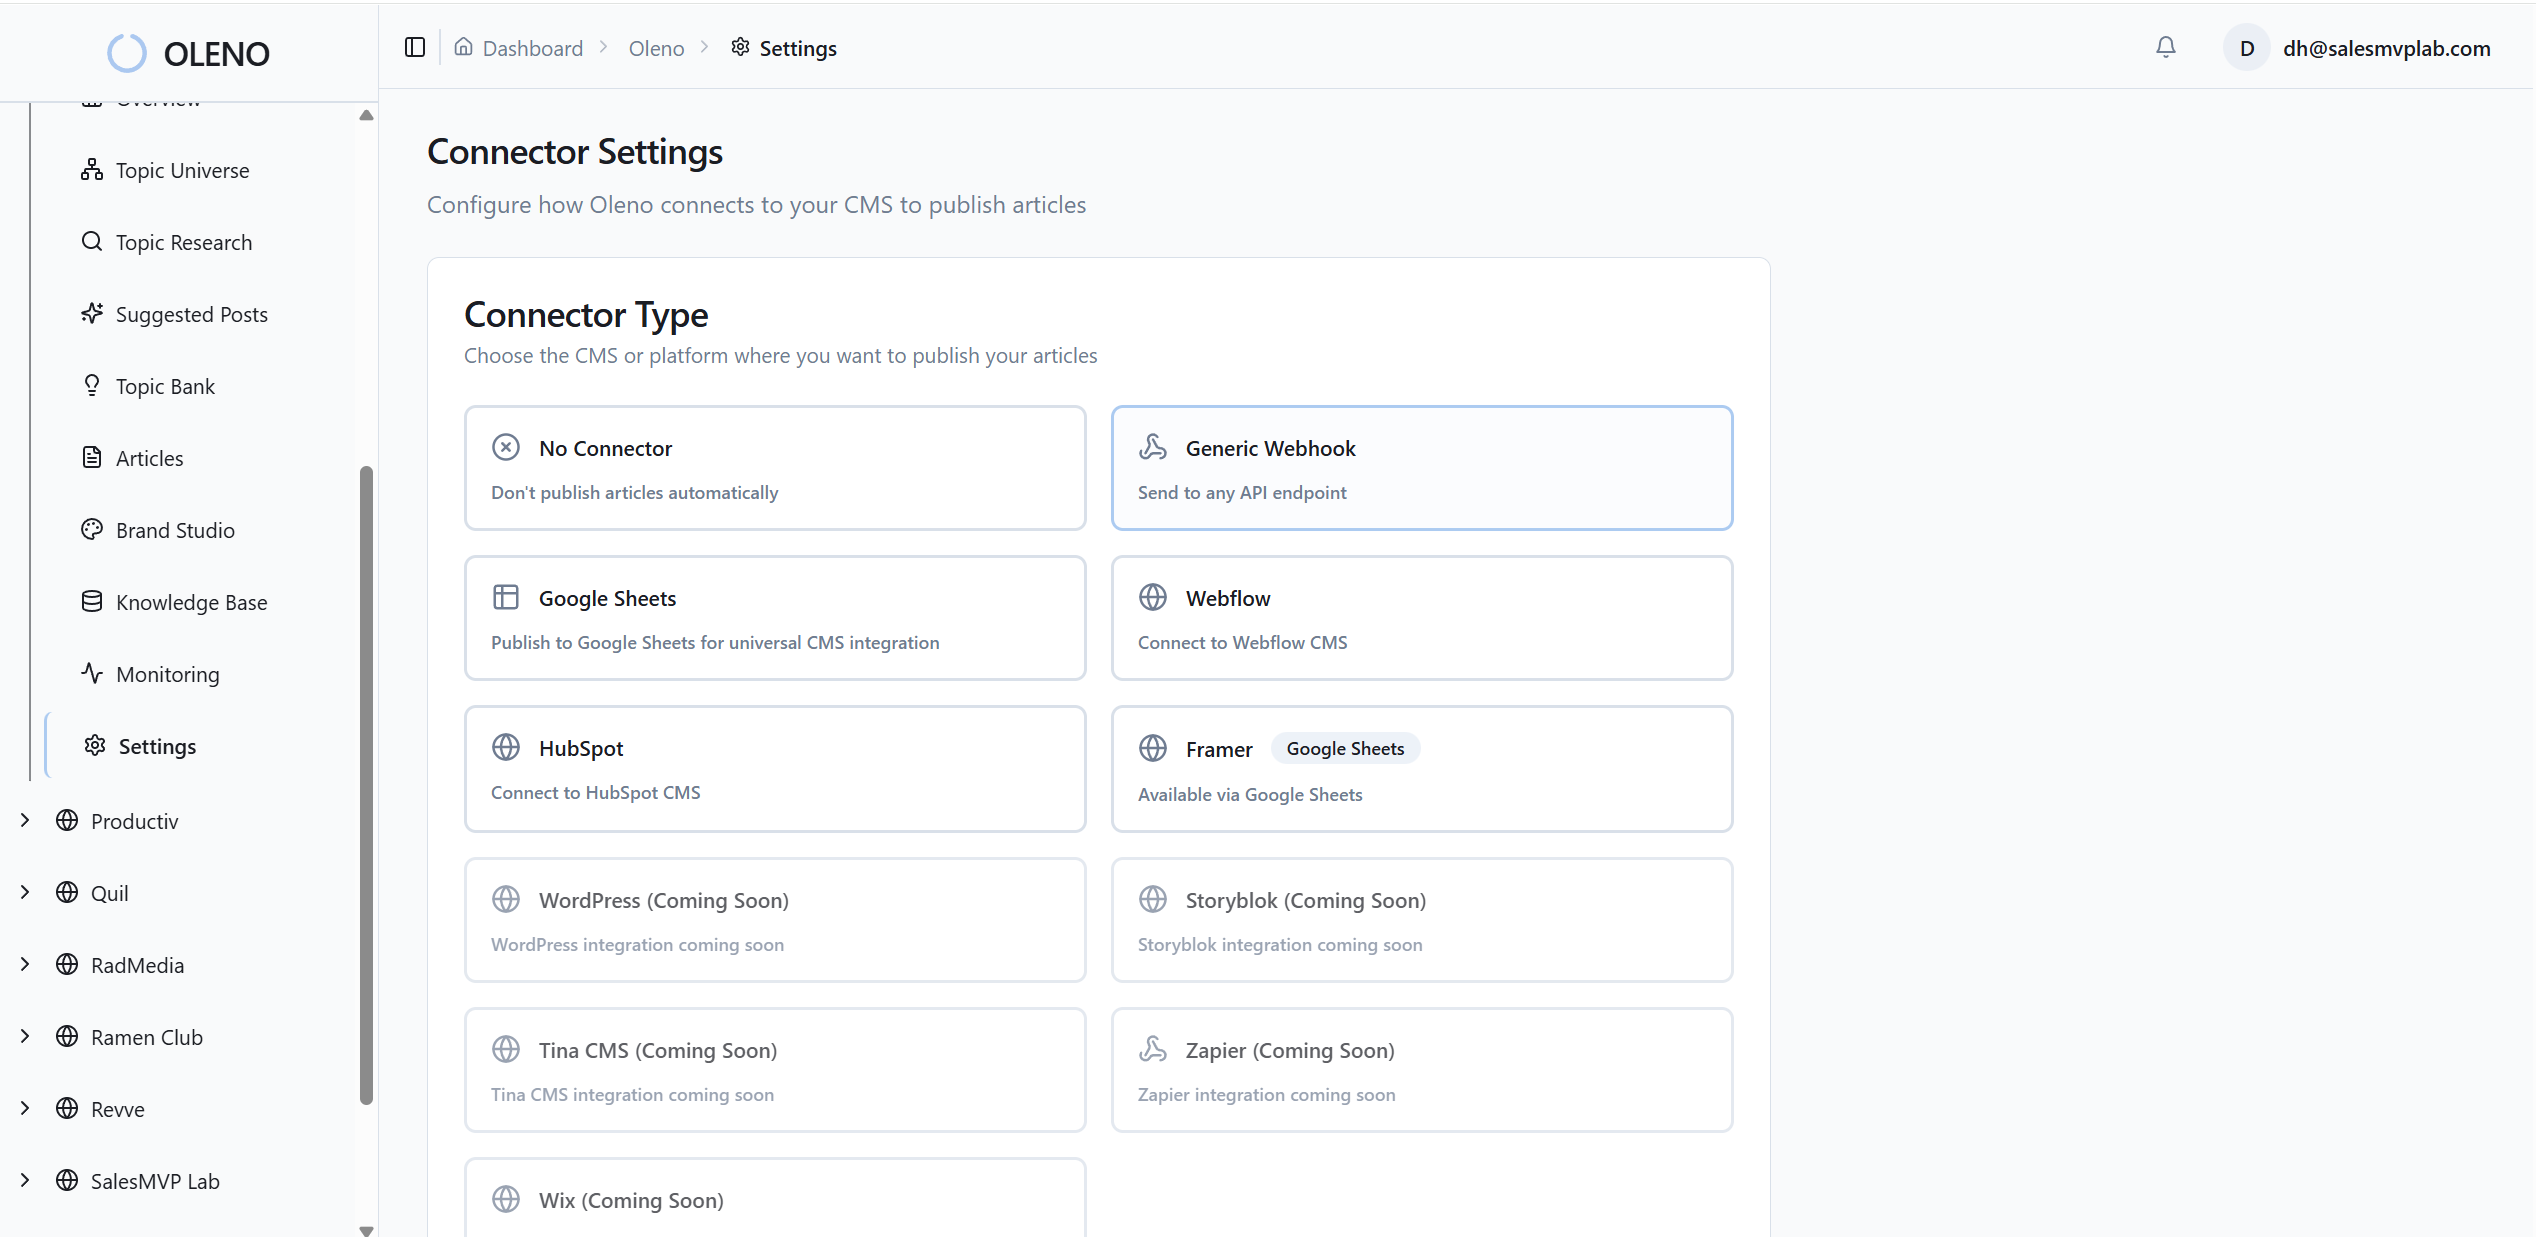
Publishing Connectors That Keep Metadata Consistent
Publishing is handled through connectors—WordPress, Webflow, HubSpot, and Google Sheets for custom flows. Oleno converts markdown to CMS-ready HTML, maps fields automatically, embeds visuals and metadata, and prevents duplicate posts. The result: stable URL patterns and consistent article_id values that your SQL definitions can depend on.
No guessing which template fired which event. Your GTM and GA rules stay simple because content publishes the same way every time. That’s what you want when you’re trying to compare last month to this month without caveats.
What Oleno Does Not Do and How to Pair It With Your Stack
Oleno does not provide analytics, dashboards, or performance monitoring. It won’t replace your BI or attribution tools. Pair Oleno’s consistent structure with GA4, your warehouse, and a simple attribution model. Use your own reporting to prove impact; let Oleno reduce the chaos in the inputs.
Here’s the practical path. Use Oleno to generate measurement-ready content—snippet-ready sections, deterministic links, schema, and publishing consistency. Use your stack to capture events, stitch identities, and report stage outcomes. When you’re ready to test it with zero overhead, Try Generating 3 Free Test Articles Now.
Conclusion
You don’t need more content. You need content with a job and a measurement plan that doesn’t collapse under its own complexity. Align KPIs to stages, clean the data, and ship a simple instrumentation and attribution playbook in one sprint. Then keep it boring and consistent.
And if you’d like the writing, structure, links, schema, and publishing handled so your team can focus on the narrative and the numbers—use a system that ships content the same way every time. That’s how you turn traffic into pipeline without arguing the spreadsheet.
About Daniel Hebert
I'm the founder of Oleno, SalesMVP Lab, and yourLumira. Been working in B2B SaaS in both sales and marketing leadership for 13+ years. I specialize in building revenue engines from the ground up. Over the years, I've codified writing frameworks, which are now powering Oleno.
Frequently Asked Questions